
Figure 3.
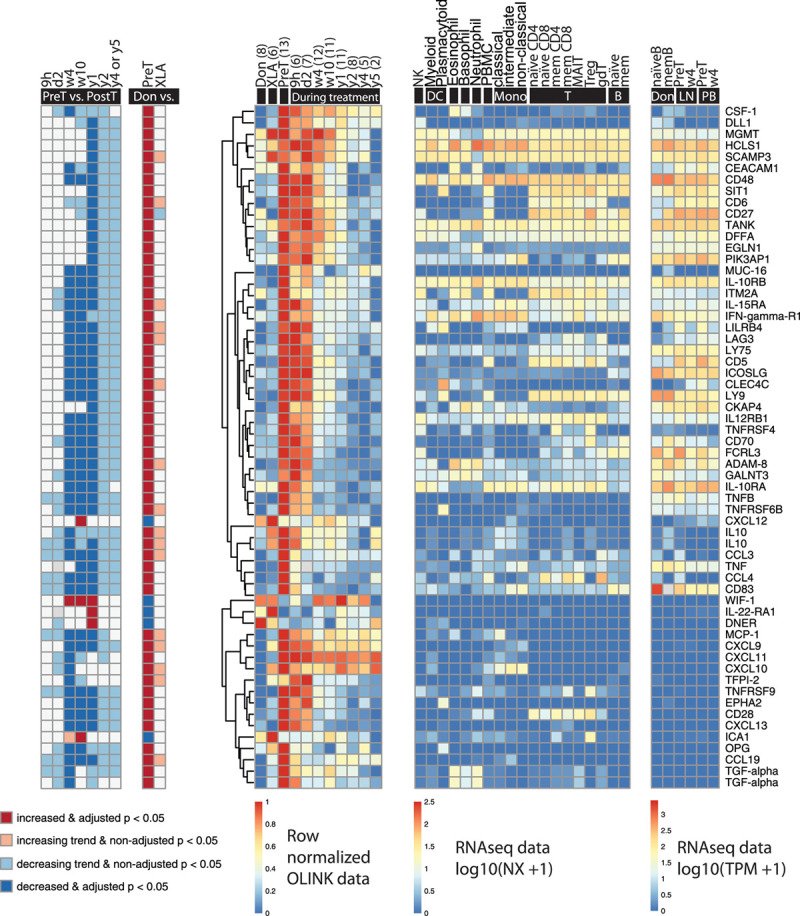
Significantly changed CLL-associated molecules during ibrutinib treatment (n = 58). Biomarkers that were different between healthy donors and patients with CLL at baseline were regarded as CLL-associated. (Left to right) The first heat-map shows significance and increase or decrease of the biomarkers at different time points during treatment compared to pretreatment; the second shows the comparison between healthy donors (6 males and 3 females, median age 65 y, range 45–79; Don), patients with CLL before the start of ibrutinib treatment (PreT) and patients with XLA (XLA); the third shows the row-normalized Olink data; the fourth shows mRNA expression in different cell types, from healthy individuals for comparison (data from Uhlen et al33); the fifth shows the mRNA expression in healthy donor and CLL B cells before and after 4 weeks of ibrutinib treatment in lymph nodes (LN) and peripheral blood (PB) (data from Palma et al8). All RNA sequencing data has been published previously.8,33 IL10 and TGF-alpha are depicted twice because 2 different Olink probes were used to assess them. The number of data points (n) is indicated per time point. B = B cells; CLL = chronic lymphocytic leukemia; DC = dendritic cells; gdT = gamma delta T cells; MAIT = mucosal-associated invariant T cells; mem = memory; Mono = monocytes; NK = natural killer cells; T = T cells; Treg = regulatory T cells.