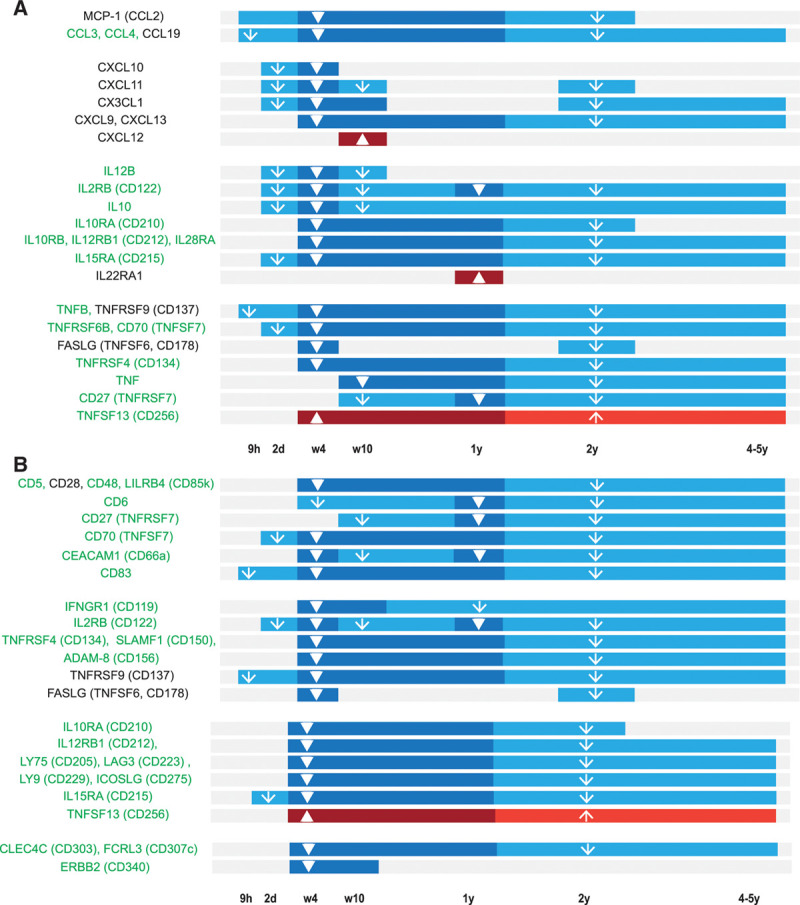
Figure 4.

Timeline of plasma biomarkers that change during ibrutinib treatment. (A) Timeline for CCL proteins, CXCL proteins, ILs, IL-Rs, TNFSF, and TNFRSF members. (B) Timeline for CD molecules. Plasma biomarkers expressed by B cells are listed in green. Statistically significant changes in the plasma levels between the respective time points and pretreatment are depicted as a dark blue (decrease) or dark red (increase) bar with a thick arrow. Trends are depicted as a light blue (decreasing tendency) or light red (increasing tendency) bar with a thin arrow. CCL = chemokine ligand; CXCL12 = C-X-C motif chemokine ligand 12.
