Figure 3.

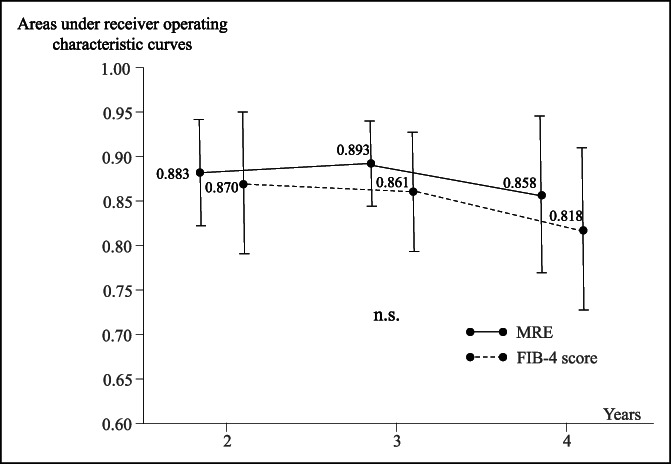
Time-dependent areas under the receiver operating characteristic curves of MRE values and FIB-4 scores. FIB-4, fibrosis-4; MRE, magnetic resonance elastography.

Time-dependent areas under the receiver operating characteristic curves of MRE values and FIB-4 scores. FIB-4, fibrosis-4; MRE, magnetic resonance elastography.