Figure 1.

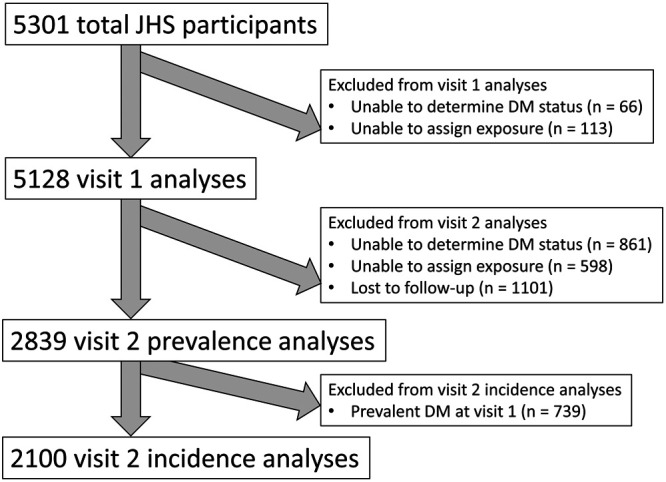
Flow diagram showing exclusion criteria and numbers of JHS participants in each analysis. Participants could be excluded for more than one reason.

Flow diagram showing exclusion criteria and numbers of JHS participants in each analysis. Participants could be excluded for more than one reason.