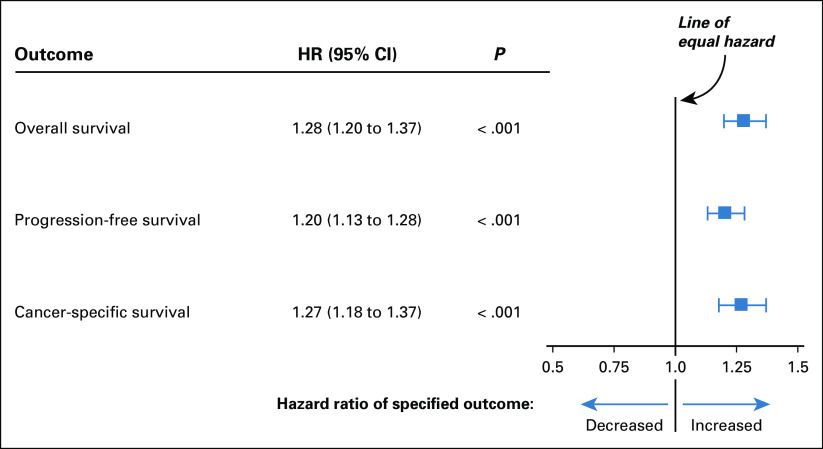
FIG 1.
Forest plot of hazard ratio comparing highest deprivation quintile versus lowest deprivation quintile. The results are from primary modeling approach, adjusting for age, race, and sex in frailty model with cancer type as random effect. The boxes in the forest plot represent the hazard ratios, and the horizontal lines are the 95% CIs; the vertical line is the line of equal hazard. HR, hazard ratio.

