
FIG 2.
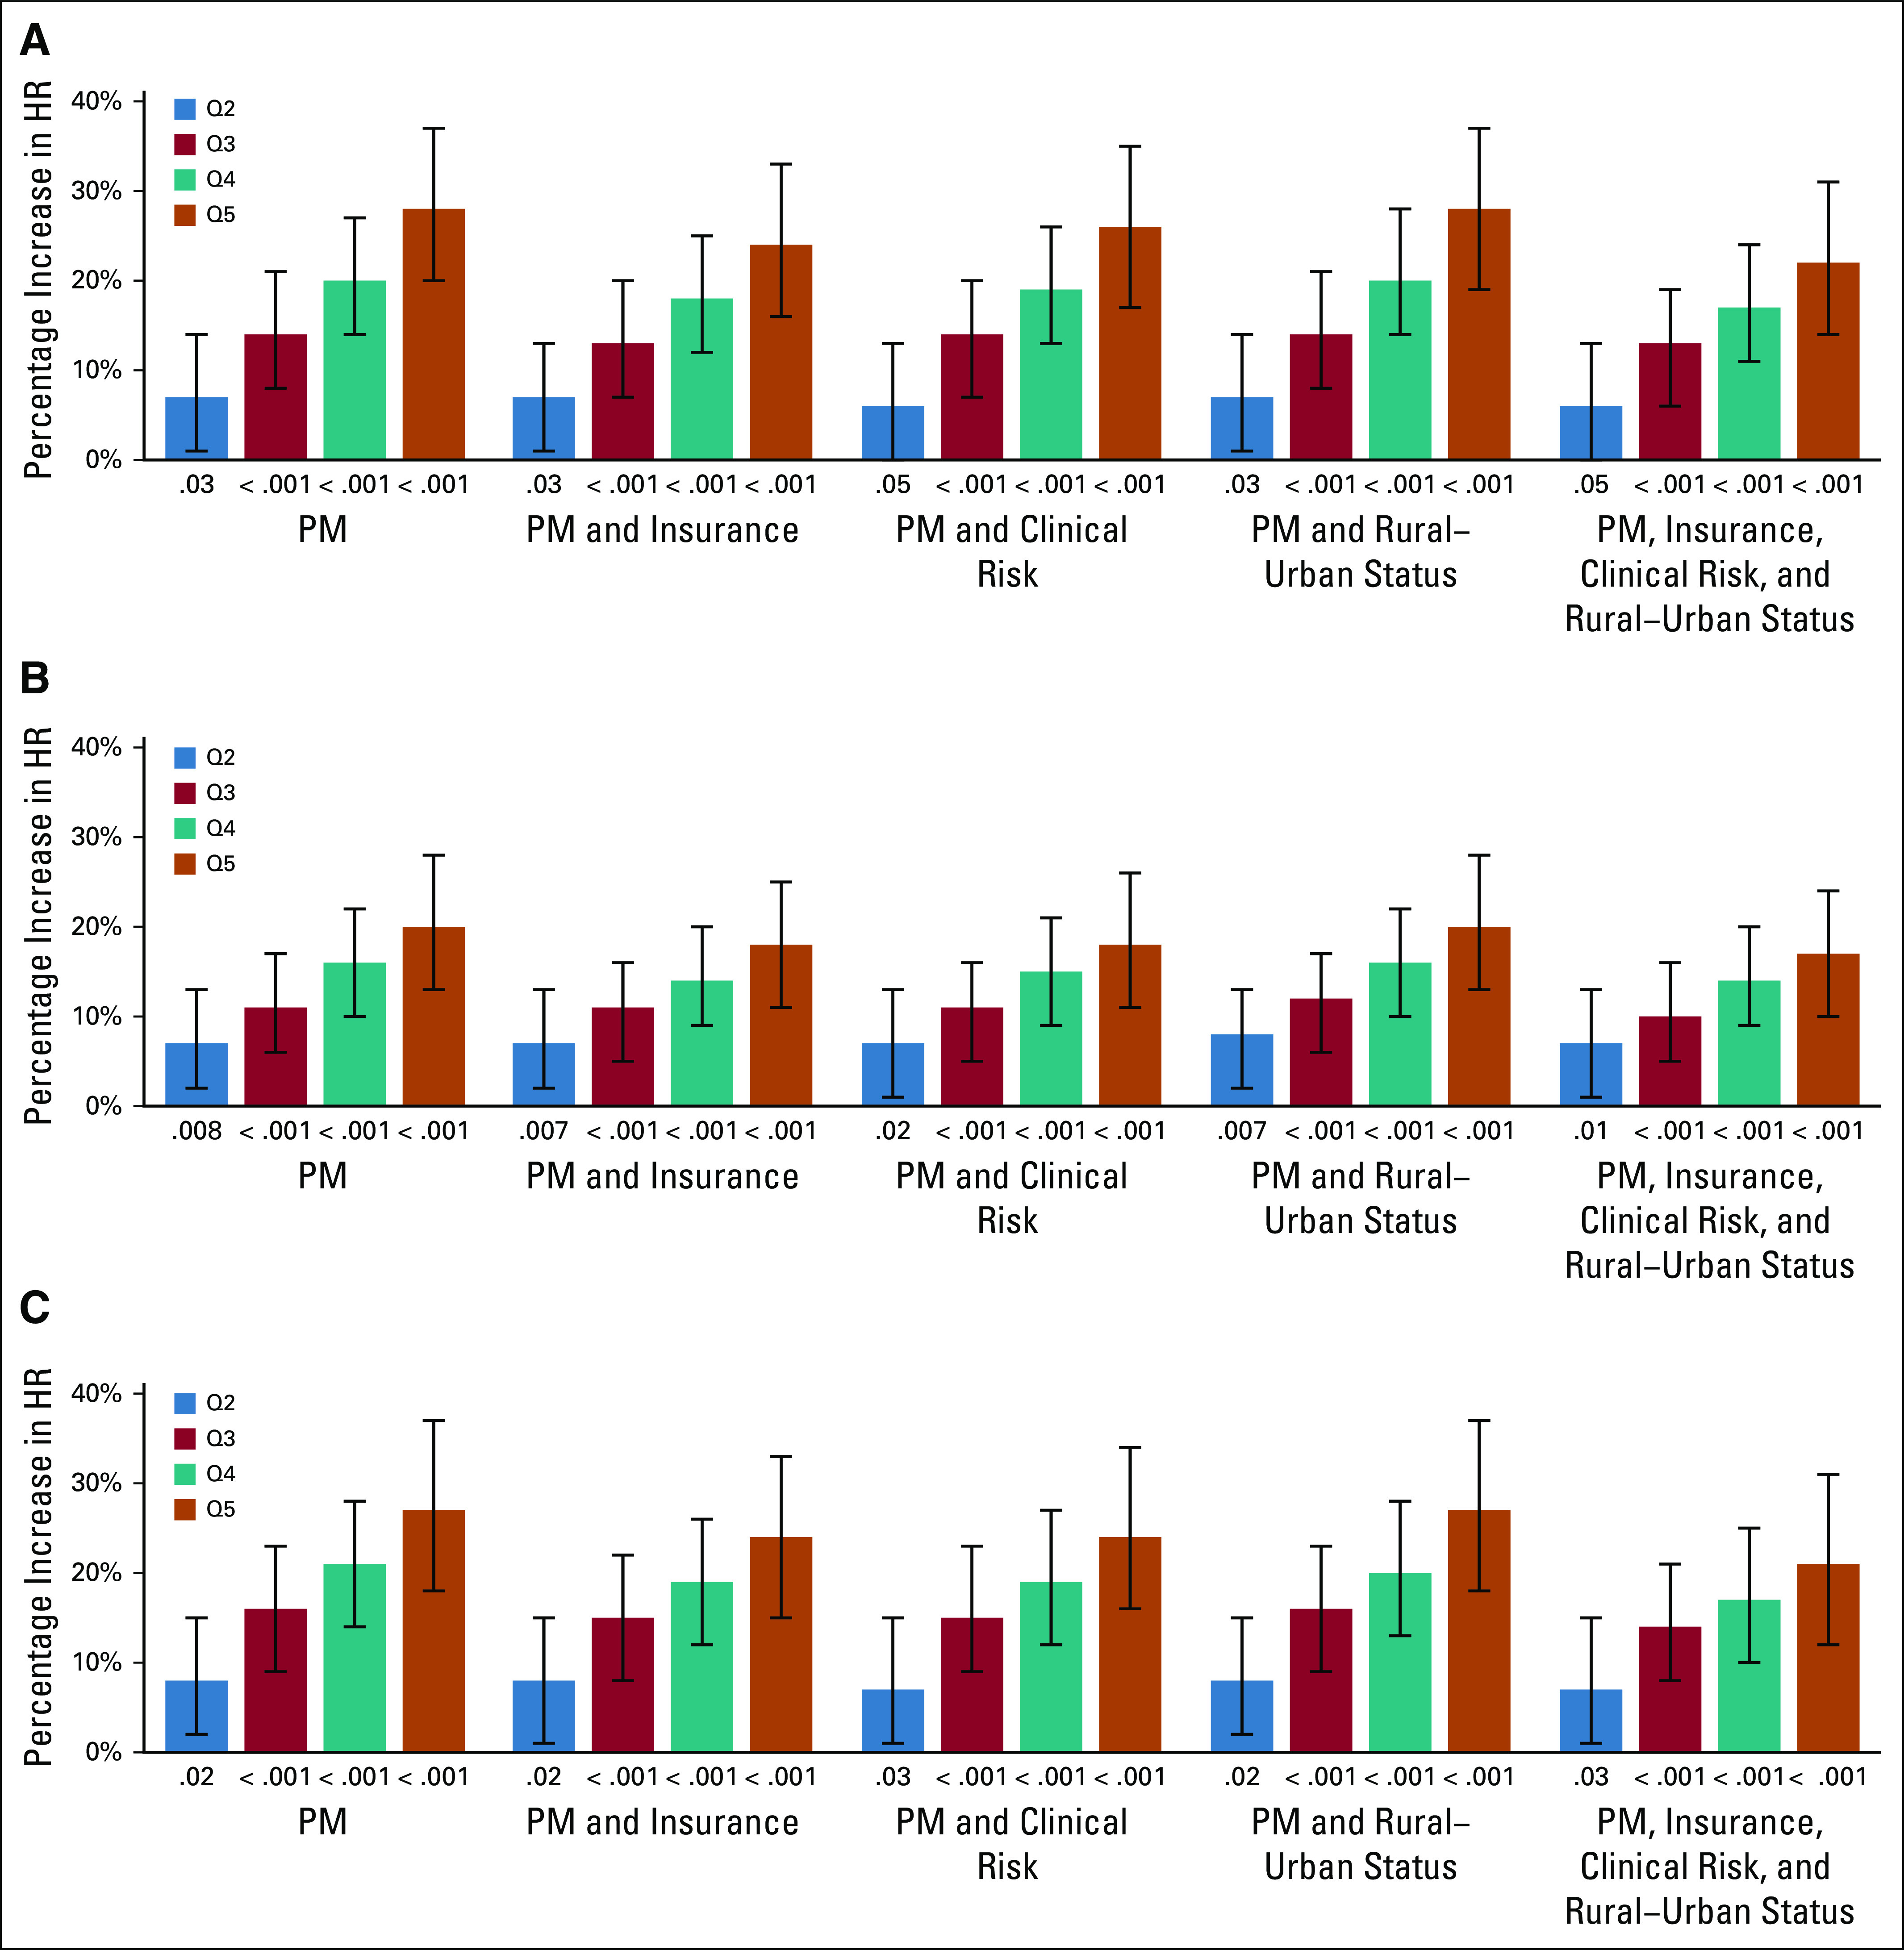
Percentage increase in HR by end point, model, and ADI quintile. (A) Overall survival, (B) progression-free survival, and (C) cancer-specific survival. The results are shown by quintile, defined as Q2, ADI 21%-40%; Q3, ADI 41%-60%; Q4, ADI 61%-80%; and Q5, ADI-81%-100%, most disadvantaged. The P value below each bar represents the comparison for the given quintile of area level deprivation with the lowest area-level deprivation quintile (Q1, ADI 0%-20%, most affluent). Analyses were conducted using Cox regression frailty models; in each model, the cancer type (Data Supplement) was considered a random effect. The vertical lines indicate the 95% CIs. ADI, Area Deprivation Index; HR, hazard ratio; PM, Primary Model.