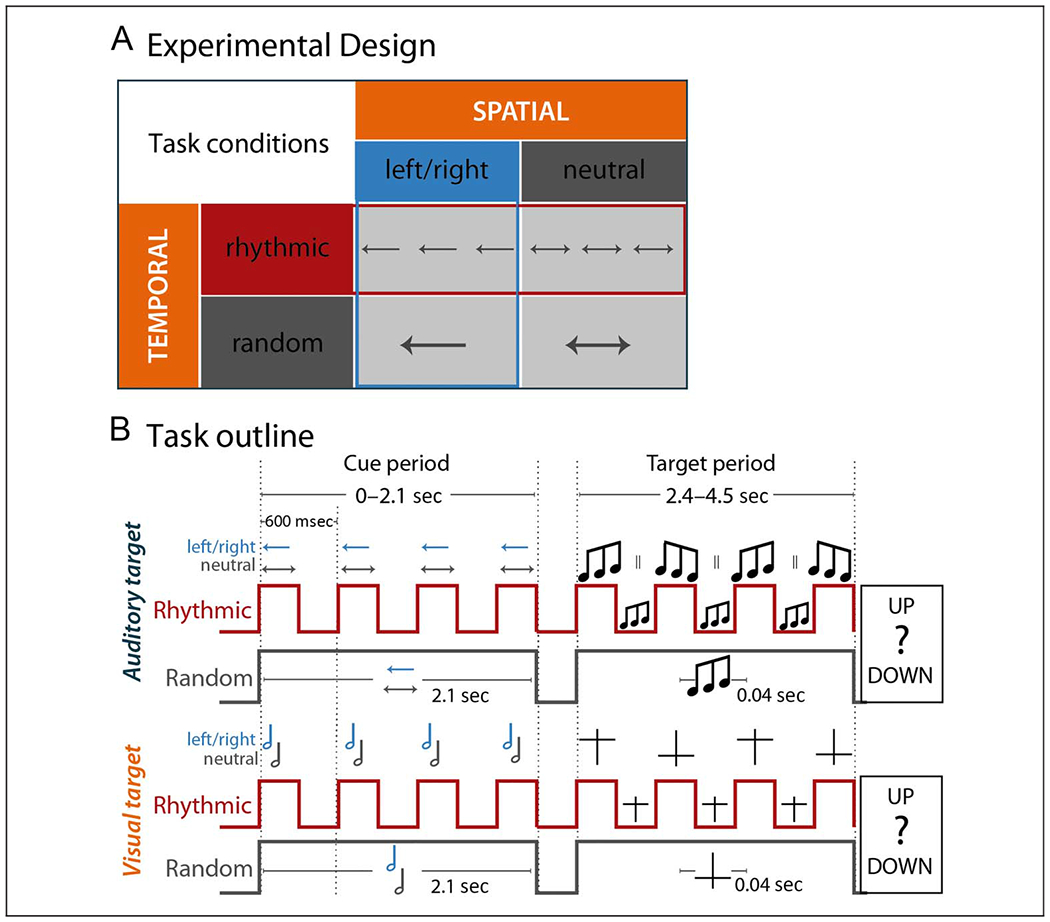
Figure 1.

Experimental design and task outline. (A) Schematic representation of the experimental manipulations: Spatial attention was modulated either with a valid cue focusing attention to the left or right (boxes with blue outline) or with a neutral cue (gray box) not providing information about the location of target occurrence. Temporal expectation was modulated either by presenting the cue rhythmically (boxes with red outline) with targets occurring in phase with the cue rhythm or by presenting the cue continuously with targets occurring at a random time point after cue presentation (gray box). (B) Trial outline separately for auditory (top) and visual (bottom) target trials and the rhythmic (red line) and random (gray line) conditions. The overall cue period ranged from 0 to 2.1 sec time-locked to cue onset. The target period started 2.4 sec after cue onset and ended 4.5 sec after cue onset. Vertical red lines display the onset and offset of the cue during the cue period illustrating the rhythmicity of cue presentation in contrast to the gray flat horizontal line in the random condition. The arrows in the auditory-target trial as well as the note signs in the visual-target trial indicate the left/right (blue) versus neutral cue information about the target location. During the target period, the red vertical lines display the possible onset of the target in-phase and antiphase with the cue rhythm. The flat gray line indicates the nonrhythmic random presentation of the target.
