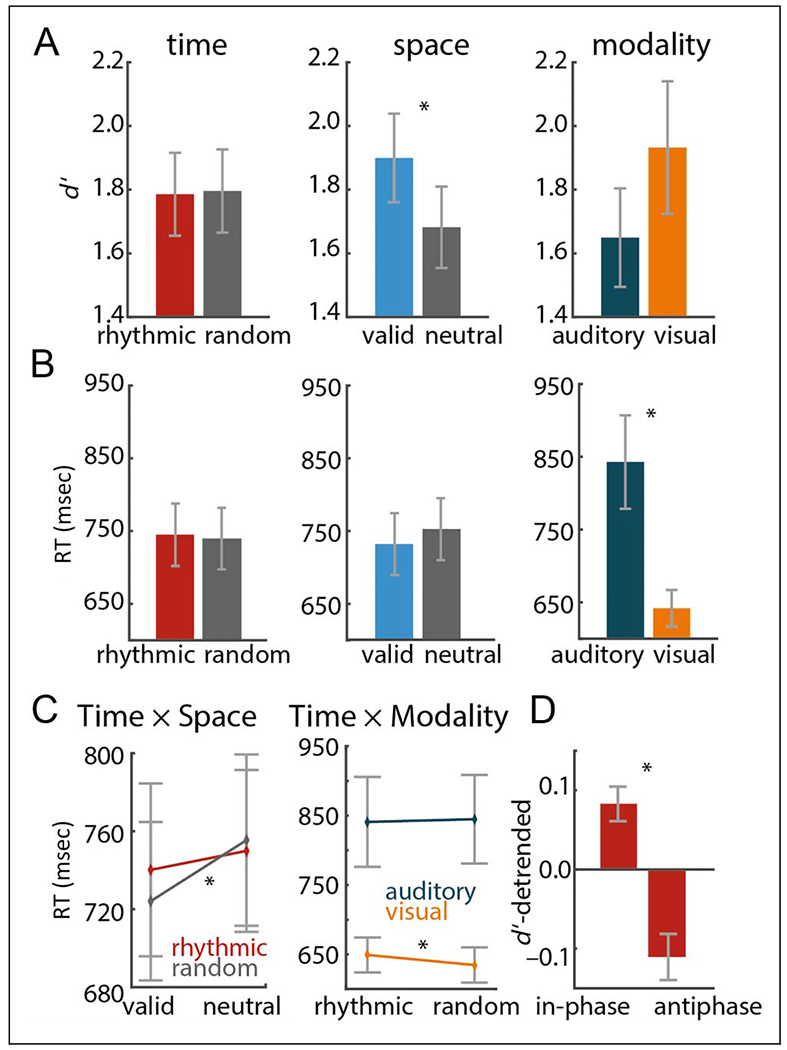
Figure 2.

Target discrimination performance. (A–C) Results of repeated-measures ANOVA (Time vs. Space vs. Modality). (A) Main effects of time, space, and modality on d’. (B) Main effects of RT. (C) Left: Interaction of time and space pooled across auditory and visual targets. Right: Interaction of time and modality pooled across left and right attended targets. (D) Contrast of d’ on rhythmic in-phase and antiphase trials, pooled across auditory and visual targets. Error bars display between-participant SEM. Asterisks indicate significant results (p < .05).
