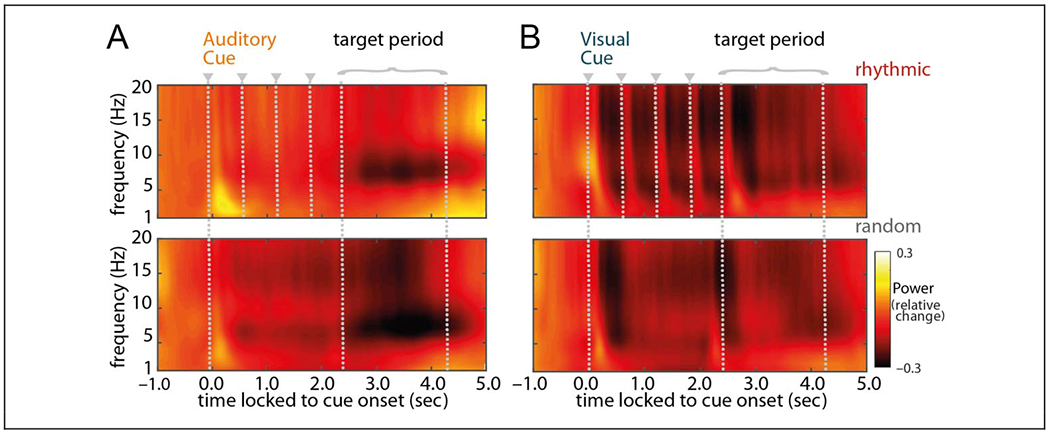
Figure 3.

Time course of grand-averaged power. TFRs from 1 to 20 Hz time-locked to cue onset, baseline-corrected with a 300-msec stimulus-free segment −0.8 to −0.5 sec before cue onset (i.e., relative change), and averaged across all sensors. Panels on the left display power averaged across all trials with an auditory cue followed by a visual target; panels on the right display power averaged across all trials with a visual cue followed by an auditory target. Top panels represent the rhythmic-cue condition; bottom panels represent the random-cue condition. Gray dotted lines mark the cue onsets (starting at t = 0 sec, plus following cues in the rhythmic condition) as well as the period during which the target was presented.
