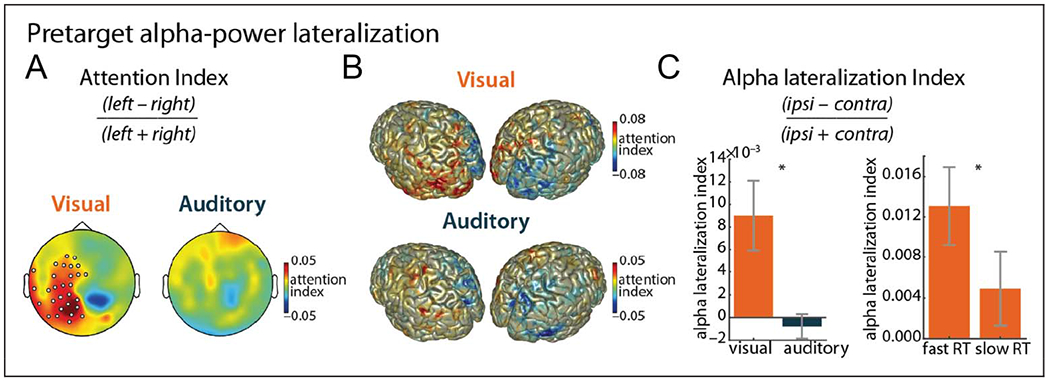
Figure 5.

Spatial attention: alpha lateralization. (A) Attention index for visual and auditory targets (8–13 Hz). Marked channels indicate a significant cluster (p = .03). (B) Source reconstruction of the attention index for visual and auditory targets (8–13 Hz). (C) Contrast of alpha lateralization index between auditory and visual targets (left) and between low and high RTs (median split; right) for visual-target trials. Error bars display between-participant SEM. Asterisks indicate significant results (p < .05).
