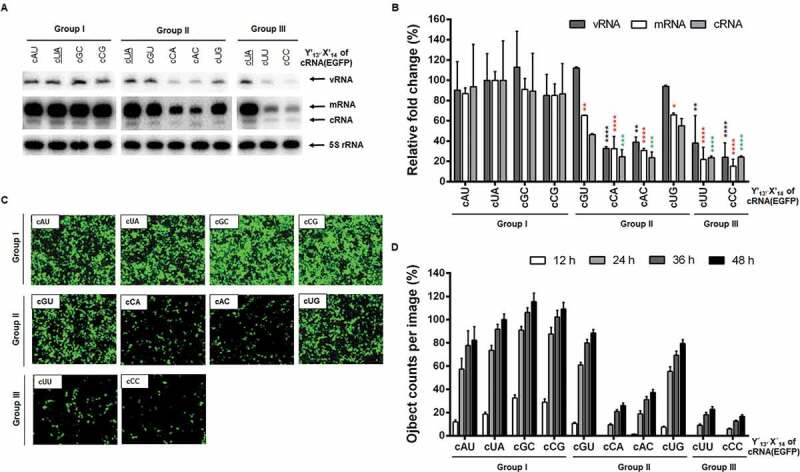
Figure 3.

RNA replication initiated from the cRNA promoter in cells. (A) Primer extension for detecting cRNA(EGFP) [162 nucleotides (nt)] and its vRNA (138 nt) or mRNA (>162 nt) transcripts. HEK 293 T cell were transfected as mentioned in Fig. 2 but by substitution with individual cY′13′X′14 reporter constructs [pHH21-cRNA(EGFP) series]. The primer extension products are indicated with arrows at the right side of the gels. The wild-type cUA sample was loaded in each panel (underlined). (B) Quantification of band intensities of (A). Values were normalized against 5S rRNA. Error bars represent SEM from three independent experiments. Relative fold changes are given as percentages of the cUA sample (100%). Statistical analysis was performed by two-way ANOVA with Dunnett’s multiple comparison test against the control sample, cUA, in vRNA (black asterisks), mRNA (red asterisks) and cRNA (green asterisks) levels. *P < 0.05, **P < 0.01, ***P < 0.001, and ****P < 0.0001. (C) At 24 h post-transfection, EGFP expression was captured by fluorescent microscopy. Original magnification, 10 ×. (D) Fluorescent spots were counted from 16 nonoverlapped areas per well every 12 h and compared with the spot number from cUA at 48 h (100%). Error bars represent SEM from four independent experiments
