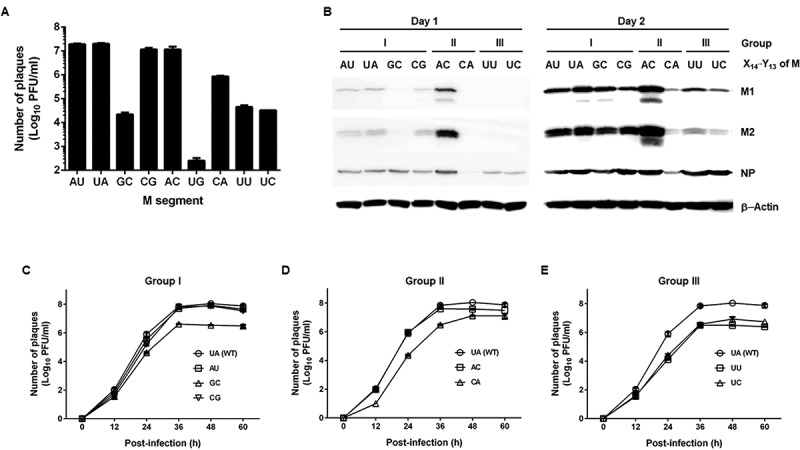
Figure 6.

Effect of the X14′·Y13 mutation on the viral protein expression and growth. (A) Plaque titration of the amplified recombinant viruses at P1. An equal volume of P0 supernatants was inoculated in MDCK cells (100 µl per well in 12-well plates) for 2 days. The number of viral particles of P1 was quantified by plaque assay and expressed as means ± SEM (log10 PFU/ml) (n = 3). (B) Western blot analysis for detecting M1 and M2 expression. MDCK cells were infected with the different recombinant viruses (P1) at an MOI of 10−4. Cell lysates harvested on days 1 (left) and 2 (right) were subjected to SDS-PAGE for immunoblotting. Viral proteins M1, M2, and NP were detected with their specific primary antibodies and subsequently HRP-conjugated secondary antibodies. Cellular β-actin was used as a loading control. Proteins are indicated on the right side of the gels. (C-E) Viral growth curve of reverse-genetically rescued recombinant viruses. Wild-type and mutant viruses of Groups I (C), II (D), and III (E) of P1 were treated in MDCK cells at an MOI of 10−4 at 35°C. Culture supernatants were harvested every 12 h for 60 h for plaque titration (log10 PFU/ml). The graphs show means ± SEM (n = 4). In all infection experiments, influenza viruses were amplified in the presence of 2 µg/ml TPCK-trypsin
