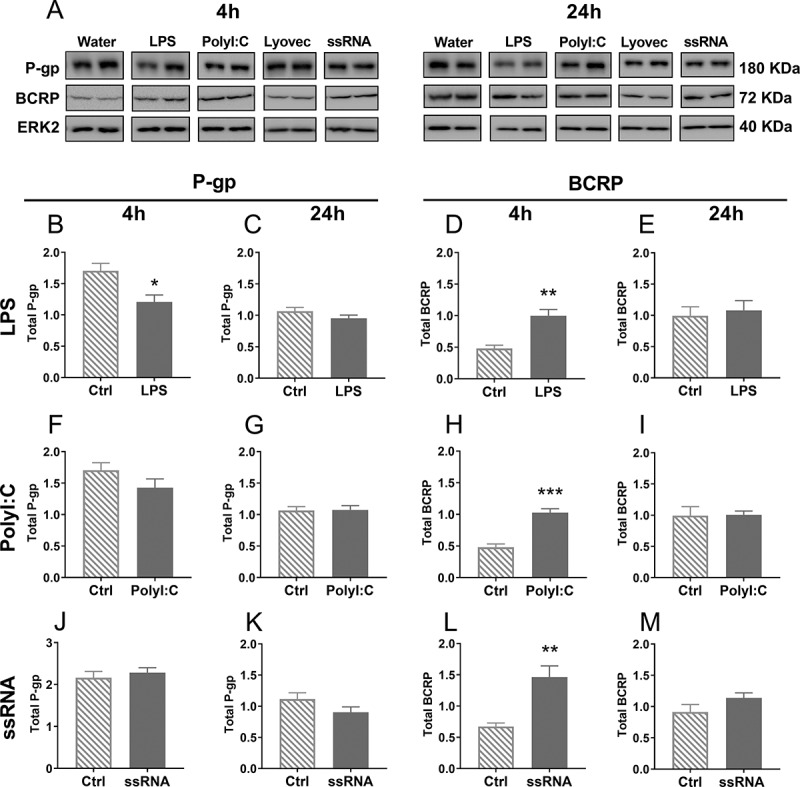
Figure 3.

Total P-gp and BCRP protein expression in BECs, 4 h or 24 h after treatment with LPS (b-e), PolyI:C (f-i) or ssRNA (j-m) and their respective controls, measured using Western blot. Representative images of P-gp, BCRP and ERK2 (loading control) bands were cropped and are shown in A. N = 4–5/group. Dose: 106 pg/mL. Statistical analysis: unpaired Student’s t-test. Data are presented as mean ± SEM. *p < .05, **p < .01 and ***p < .001
