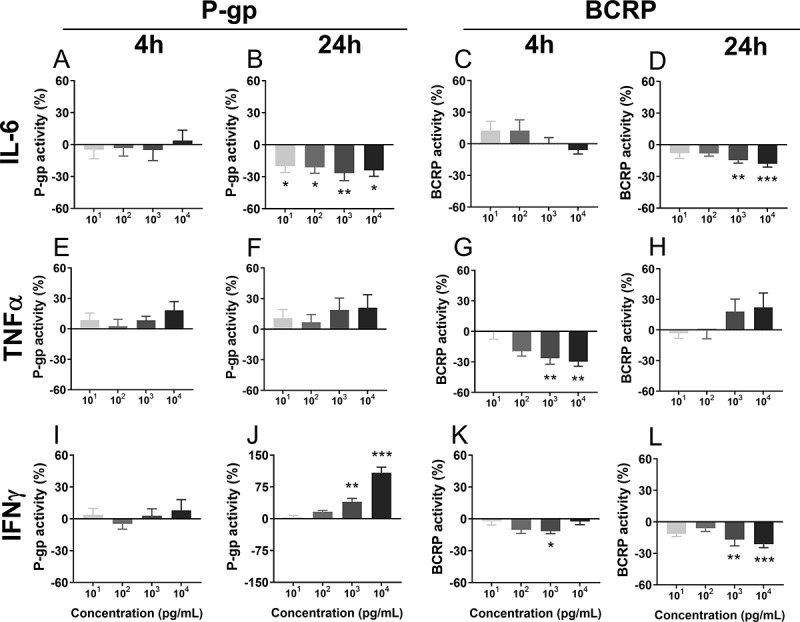
Figure 5.

P-gp and BCRP function 4 h or 24 h after treatment with the pro-inflammatory factors IL-6 (a-d), TNF-α (e-h) or IFN-ɣ (i-l), measured using the Ca-AM and Ce6 assays. Dose: 101–104 pg/mL. N = 6–8/group. Values are expressed as a percentage of controls (vehicle). Data are presented as mean ± SEM. Statistical analysis: Kruskal-Wallis test, followed by Dunn’s multiple comparison test. *p < .05, **p < .01 and ***p < .001
