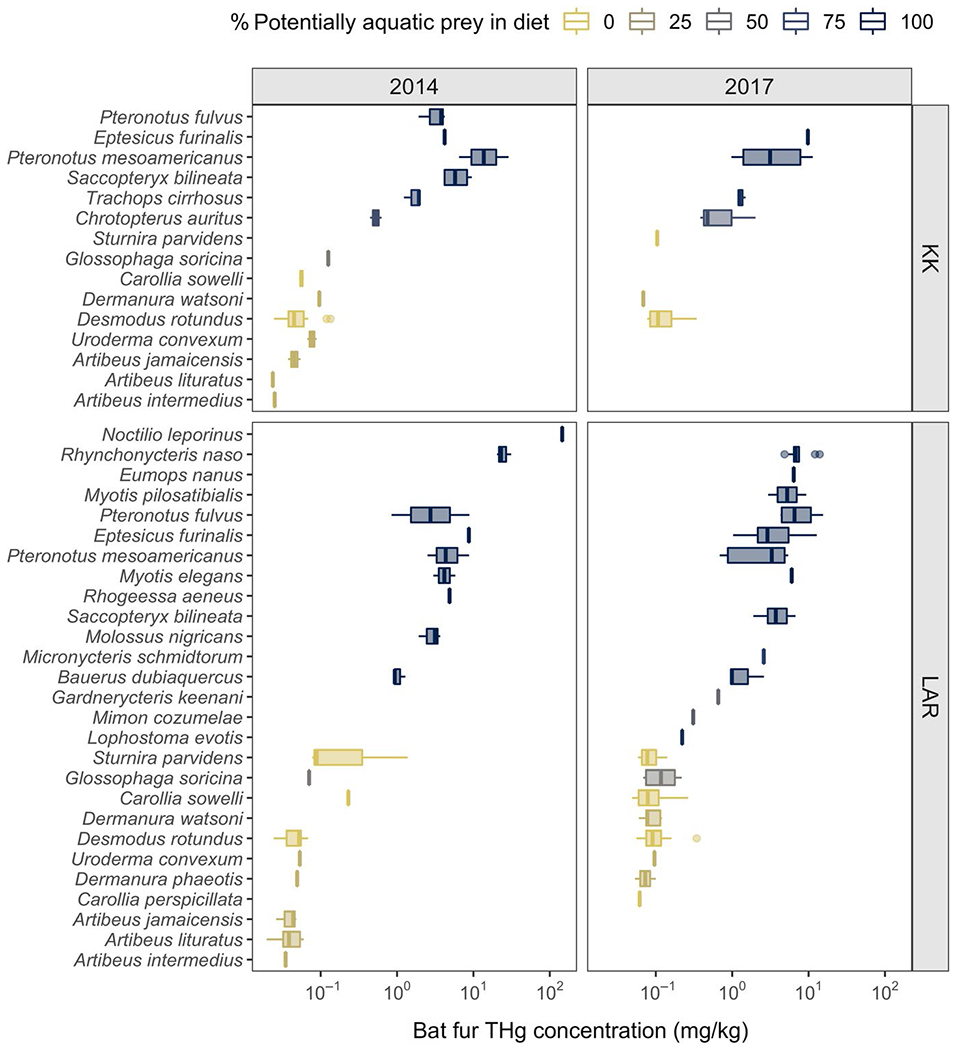
FIGURE 1.

THg concentrations in bat fur across Neotropical bat species sampled in 2014 and 2017 across two sites in Belize. Boxplots are coloured by the proportion of potentially aquatic prey in bat diets from the EltonTraits database. THg concentrations are displayed on a log10 scale
