7.

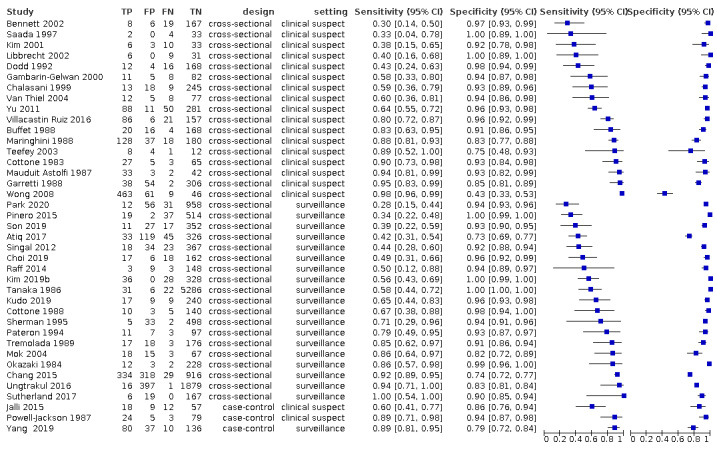
Forest plots of sensitivity and specificity of ultrasound against different reference standards.in 39 studies. Reference standards were: the pathology of the explanted liver in case of transplantation.;the histology of resected focal liver lesions, or the histology of biopsied focal liver lesion(s) with a follow‐up period of at least six months, typical characteristics on cross‐sectional multiphasic contrast CT or MRI, with a follow‐up period of at least six months. TP = true positive; FP = false positive; FN = false negative; TN = true negative. Values between brackets are the 95% confidence intervals (CIs) of sensitivity and specificity. The figure shows the estimated sensitivity and specificity of the study (blue square) and its 95% CI (black horizontal line).The individual studies are ordered by study design (cross‐sectional or case‐control), study setting (clinical setting or surveillance program) and increasing sensitivity.
