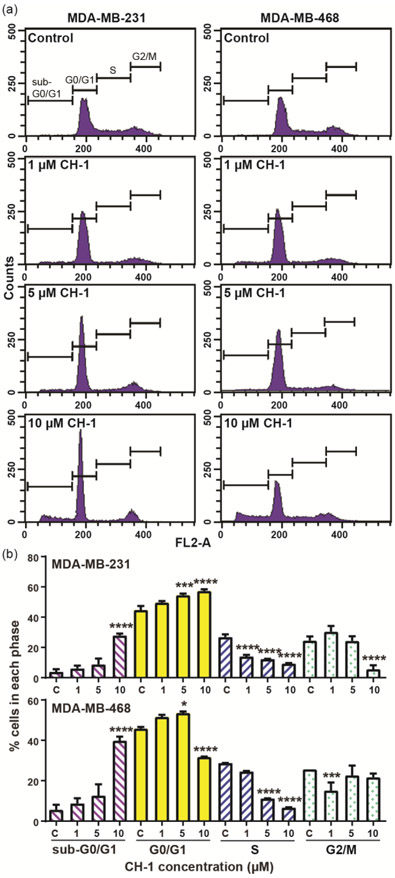
Figure 3.
(a) Representative histograms of the cell cycle distribution of MDA-MB-231 and MDA-MB-468 and (b) the average of triplicate sample measurements of the percentage of cells in the different phases after treatment with CH-1 or DMSO (control), as measured by flow cytometry. The cells were treated with DMSO (control) or 1, 5, or 10 μM CH-1 for 24 hours. RNA was digested with ribonuclease A, and DNA was stained with propidium iodide (PI) for analysis by flow cytometry. * p ≤ 0.05, ** p ≤ 0.01, *** p ≤ 0.001, and **** p ≤ 0.0001 versus control.

