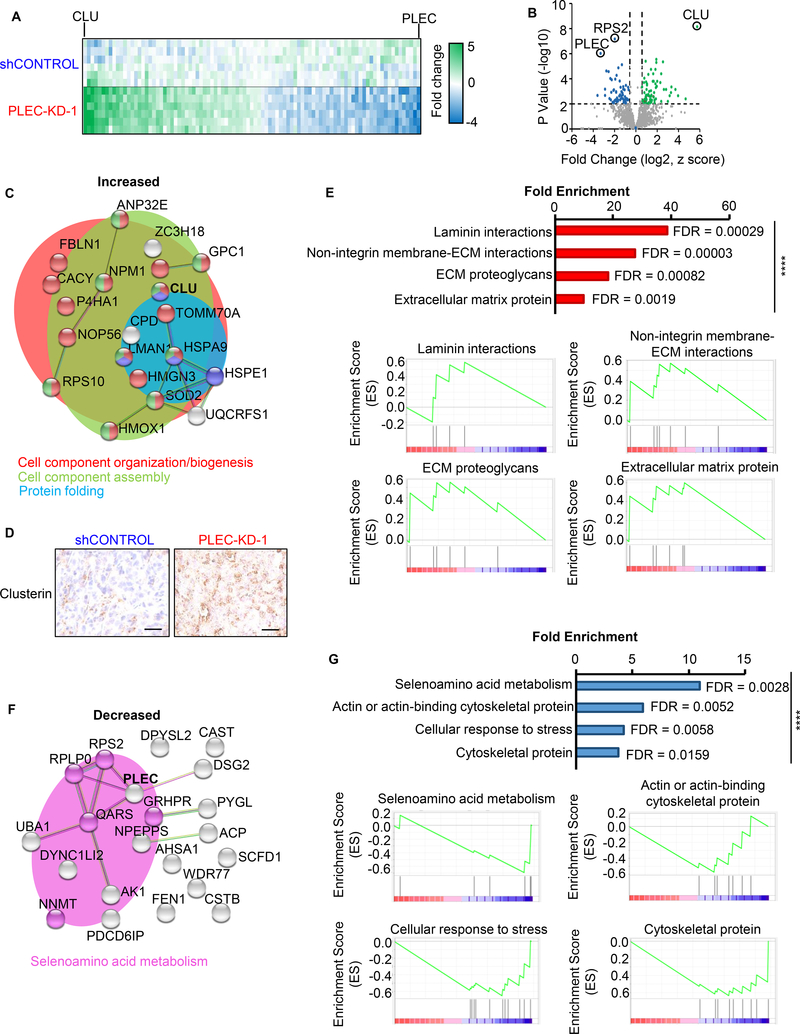
Figure 3. Proteomic analysis identifies the effects of plectin knock-down on cellular organization.
DU145 shControl or PLEC-KD-1 tumors (n=2) from Figure 2D were homogenized and lysed for proteomic analysis. (A) Liquid chromatography tandem mass spectrometry (LC-MS/MS) was performed, with triplicate analysis. The heat map indicates protein levels from −4 to +5-fold change. Green and blue indicate proteins with increased and decreased levels in plectin knock-down tumor samples respectively. (B) Volcano plot of fold changes vs. p-value. Proteins with ≥1.5-fold change, P<0.01, and a FDR of <1% are colored. (C) Functional protein association networks for proteins with increased levels in PLEC-KD tumor tissues were analyzed using STRING (https://string-db.org/). Line thickness indicates the strength of data to support correlation between each node. Enriched reactomes are indicated by color: red=cell component organization/biogenesis; green=cell component assembly; and blue=protein folding. (D) IHC of DU145 xenografts for clusterin (gene CLU), most significant protein from (C). Scale bar represents 25 microns. (E) Gene set enrichment analysis (GSEA) for increased proteins from PLEC-KD tumor tissue, P<0.05 with overrepresentation analysis. Reactome pathways are graphed by fold enrichment with indicated false discovery rates (FDR). Enrichment scores for each pathway graphed below. (F) Functional protein association networks for proteins decreased in PLEC-KD-1 tumors using STRING. Pink coded proteins indicate selenoamino acid metabolism. (G) GSEA of decreased proteins. (Top) Fold enrichment reactome pathways. (Bottom) Enrichment score graphed per pathway. **** = P<0.001.

