
Figure 4.
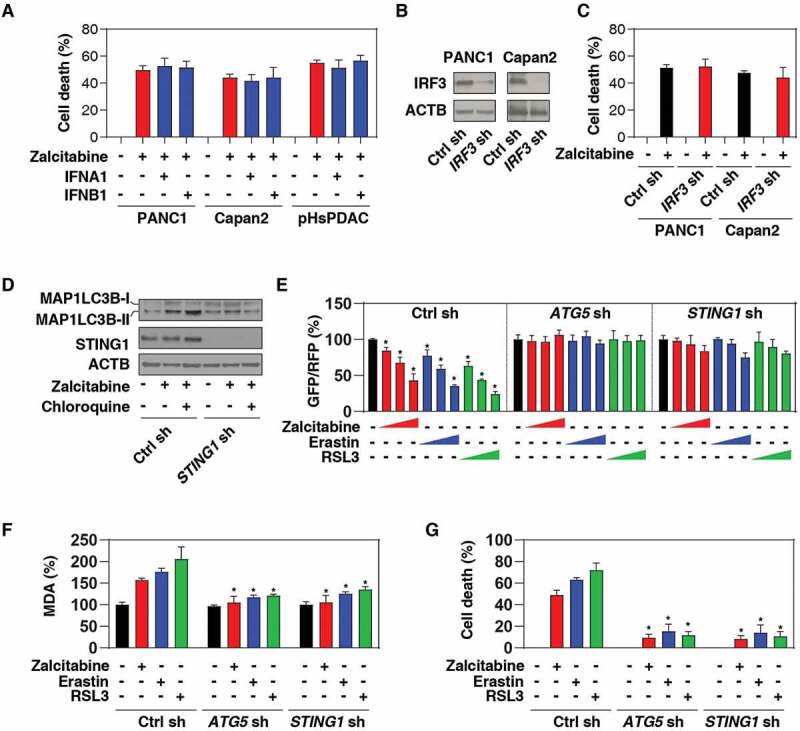
STING1-mediated autophagy promotes zalcitabine-induced ferroptosis. (A, B) Analysis of cell death in the indicated human PDAC cells following treatment with zalcitabine (20 µM) in the absence or presence of IFNA1 (5 ng/ml) or IFNB1 (5 ng/ml) for 72 h (n = 3). (B) Western blot analysis of IRF3 expression in the indicated IRF3-knockdown PDAC cells. (C) Analysis of cell death in the indicated human PDAC cells following treatment with zalcitabine (20 µM) for 72 h (n = 3). (D) Western blot analysis of MAP1LC3B in the indicated PANC1 cells following treatment with zalcitabine (20 µM) in the absence or presence of chloroquine (20 µM) for 72 h. (E) Analysis of the time course of relative GFP/RFP ratio in the indicated PANC1 cells expressing GFP-RFP-LC3ΔG in response to zalcitabine (20 µM; 24, 48, and 72 h), erastin (10 µM; 6, 12, and 24 h), or RSL3 (0.5 µM; 6, 12, and 24 h) (n = 3, *P < 0.05 versus untreated group). (F, G) Analysis of levels of MDA (F) and cell death (G) in the indicated PANC1 cells in response to zalcitabine (20 µM, 72 h), erastin (10 µM, 24 h), or RSL3 (0.5 µM, 24 h) (n = 3, *P < 0.05 versus control shRNA group)