
Figure 3.
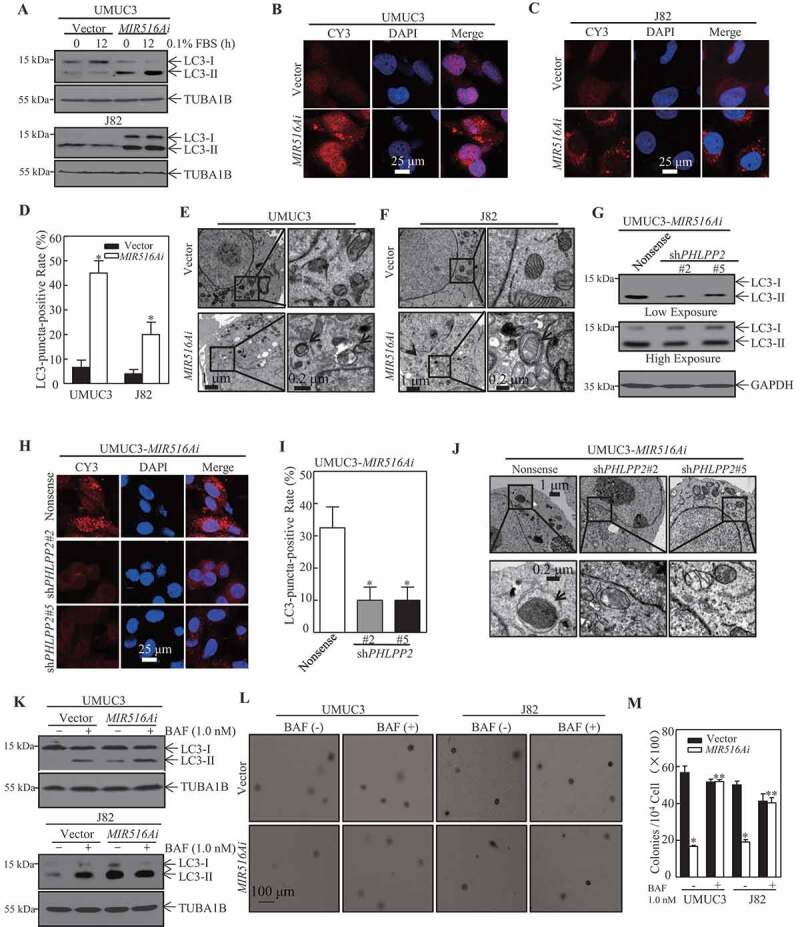
PHLPP2-mediated autophagy was involved in MIR516A regulation of the growth of BC cells. (A) UMUC3-MIR516Ai, UMUC3-Vector, J82-MIR516Ai, and J82-Vector cells were serum-starved for 12 h, and the protein levels of LC3-I and LC3-II were assessed by western blotting. (B, C, and H) The LC3 puncta formation of indicated cells was detected by immunofluorescence, and images were acquired using a microscope. (D and I) The LC3-puncta-positive cell rate was calculated as described in the section of “Materials and Methods.” An asterisk (*) indicates a significant change compared with the vector (or nonsense) control group (p < 0.05). (E, F and J) Electron microscopy analysis of autophagosome in the indicated BC cell transfectants. Black arrows, autophagosomes. (G) The protein levels of LC3-I and LC3-II of indicated cells were assessed by western blotting. (K) UMUC3-MIR516Ai, UMUC3-Vector, J82-MIR516Ai, and J82-Vector cells were seeded into each well of 6-well plates and pretreated with BAF (1.0 nM) for 12 h. The cell extracts were subjected to western blotting. (L and M) UMUC3-MIR516Ai, UMUC3-Vector, J82-MIR516Ai, and J82-Vector cells were subjected to soft agar assay with or without the presence of BAF (1.0 nM). Colonies were counted under a microscope and representative images of colonies were also captured (L). The results showed the colonies per 104 cells and are expressed as the mean ±SD (M). An asterisk (*) indicates a significant decrease in comparison to vector transfectants (p < 0.05). An asterisk (**) indicates a significant increase compared with the vehicle control (p < 0.05)