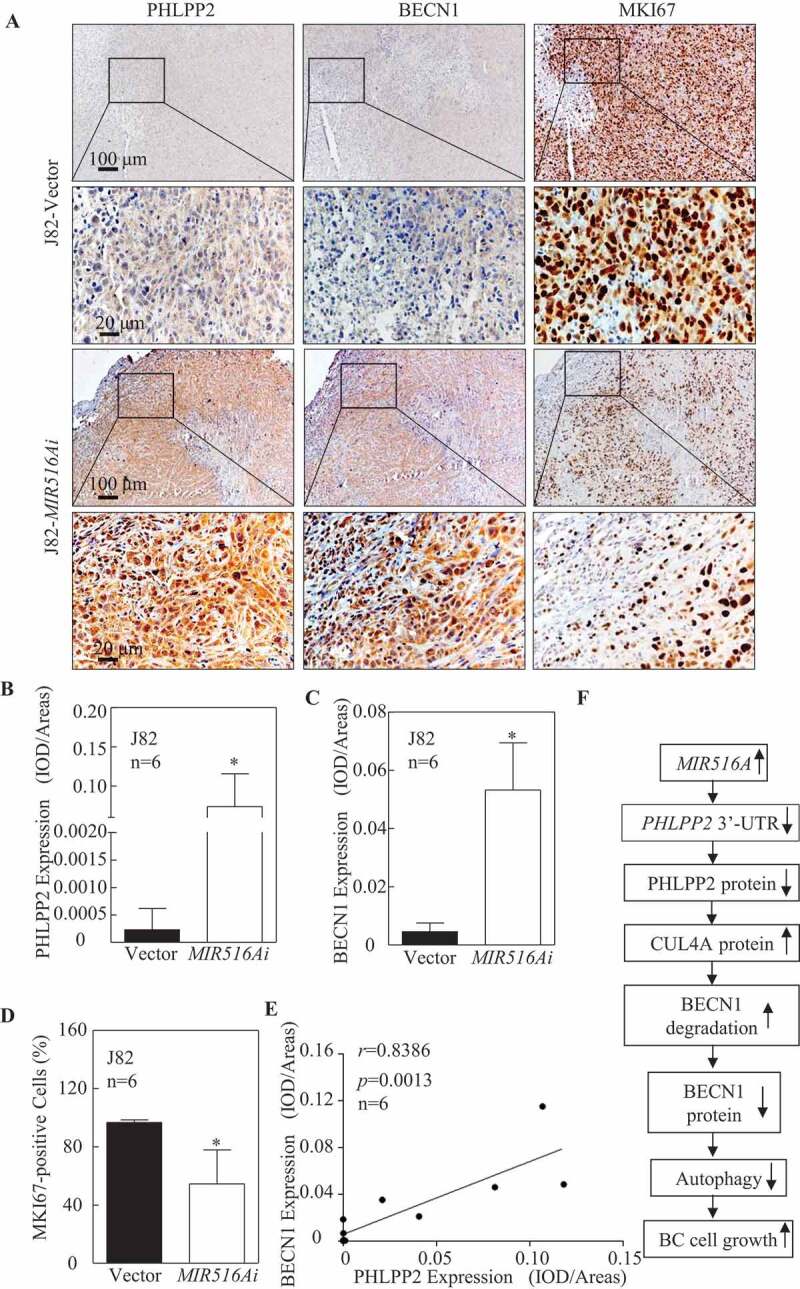
Figure 6.

The expression of PHLPP2, BECN1, and MKI67 was determined by IHC staining in the xenograft tumor tissues. (A to D) Representative IHC images showing the expression of PHLPP2, BECN1, and MKI67 in xenograft tumor tissues. Protein expression levels of PHLPP2 (B) and BECN1 (C) were analyzed by calculating the integrated optical density per stained area (IOD/area) using Image-Pro Plus version 6.0, and the MKI67-positive cell rate was analyzed by as described in the section of “Materials and Methods” (D). Results are presented as the mean ± SD. Student′s t-test was used to determine the p-value (*p < 0.05). (E) Positive correlation between PHLPP2 and BECN1 expression in xenograft tumor tissues from nude mice. (F) Schematic mechanisms underlying the effect of MIR516A upregulation of promoting BC growth
