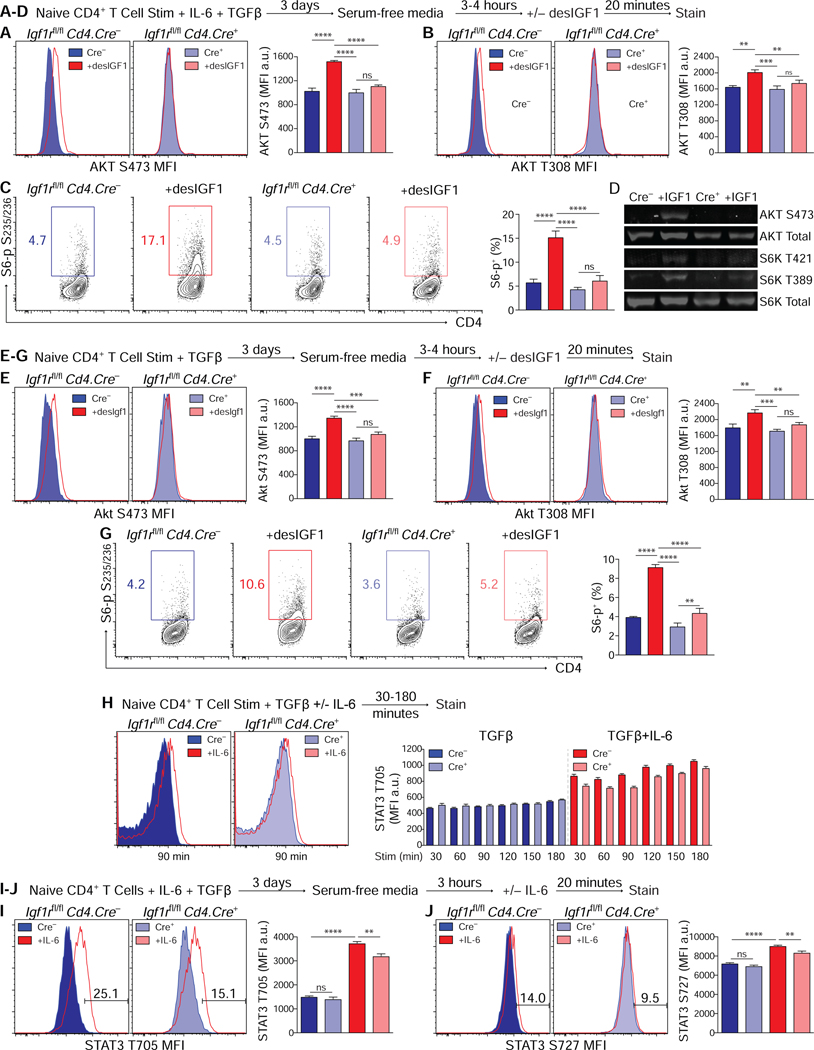
Figure 2. IGF1R signaling activates AKT-mTOR in Th17 and Treg cells.
(A-G) Sorted naive CD4+ T cells were activated for 3 days in Th17 or Treg cell conditions, washed and serum-starved for 4–5 hours, then re-stimulated with desIGF1 for 15 minutes. (A-C) Flow cytometric analysis of phosphorylation of AKT S473 (A) AKT T308 (B) and S6 ribosomal protein (C), Th17 cell conditions. (D) Immunoblot analysis of phosphorylation of AKT and S6-kinase, Th17 cell conditions. (E-G) Flow cytometric analysis of AKT S473 (E) AKT T308 (F) and S6 ribosomal protein (G), Treg cell conditions. Data for A-G are representative of 2 (D) to 3 (A-C, E-G) experiments.. (H) Splenocytes were stimulated with anti-CD3 and TGFβ with and without IL-6 for the indicated time. Phosphorylation of STAT3 T705 was analyzed by flow cytometry. (I-J) Sorted naive CD4+ T cells were activated for 3 days in-vitro in Th17 cell conditions, washed and serum-starved for 4–5 hours, then re-stimulated with desIGF1 for 15 minutes. Phosphorylation of STAT3 T705 (I) and S727 (J) were analyzed by flow cytometry. Data for I-J are representative of 3 experiments. Data were analyzed using two-way ANOVAs with Tukey’s post-hoc multiple comparisons test. See also Supplementary Fig. S3.

