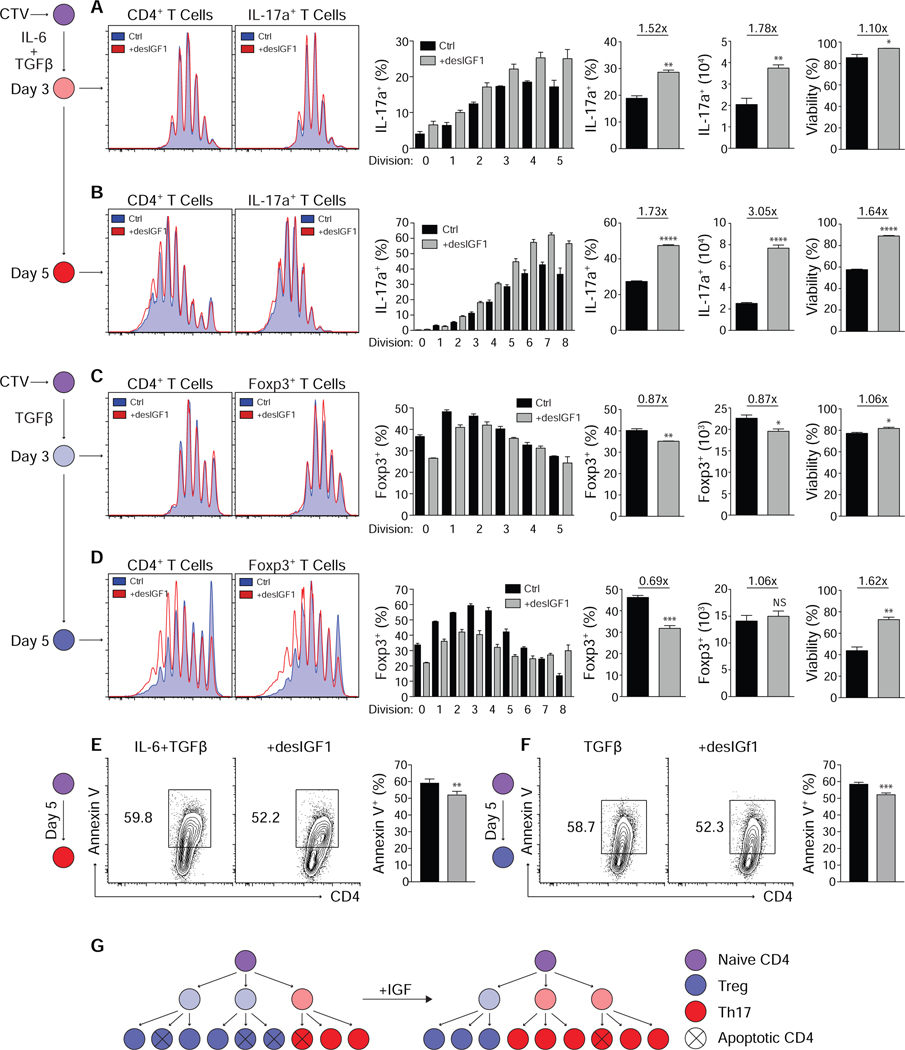
Figure 4. Signaling through IGF1R suppresses induction of Foxp3, enhances Th17 cell development and suppresses apoptosis in mature Th17 and Treg cells.
(A-D) Sorted naive CD4+ T cells were labeled with CellTrace Violet and stimulated in Th17 (A+B) or Treg (C+D) cell conditions with or without 20ng/mL desIGF1 for 3 (A+C) or 5 (B+D) days then assessed for expression of IL-17a and Foxp3 by flow cytometry. Flow plots are gated on total live (left) or IL-17a+ and Foxp3+ (right) cells. The left-most bar graphs indicate the percent IL-17a+ (A+B) or Foxp3+ (C+D) within each Cell Trace Violet peak. Bar graphs to the right indicate the percent and total number of IL-17a+ or Foxp3+ cells as well as the percent of cells staining negative for a dead-cell marker (far right). (E+F) Sorted naive CD4+ T cells were stimulated in Th17 (E) or Treg (F) cell conditions for 5 days. Cell viability and surface Annexin V were assessed by flow cytometry. Flow cytometry plots are gated on total live CD4+ cells and depict cell-number controlled concatenated data of three replicates from one representative experiment. (G) Graphic depicting the clonal expansion of naive CD4+ T cells following activation with and without exogenous desIGF1. Data from one representative experiment of 3 is shown. Student’s t-tests were used to assess significance. See also Supplementary Fig. S5.

