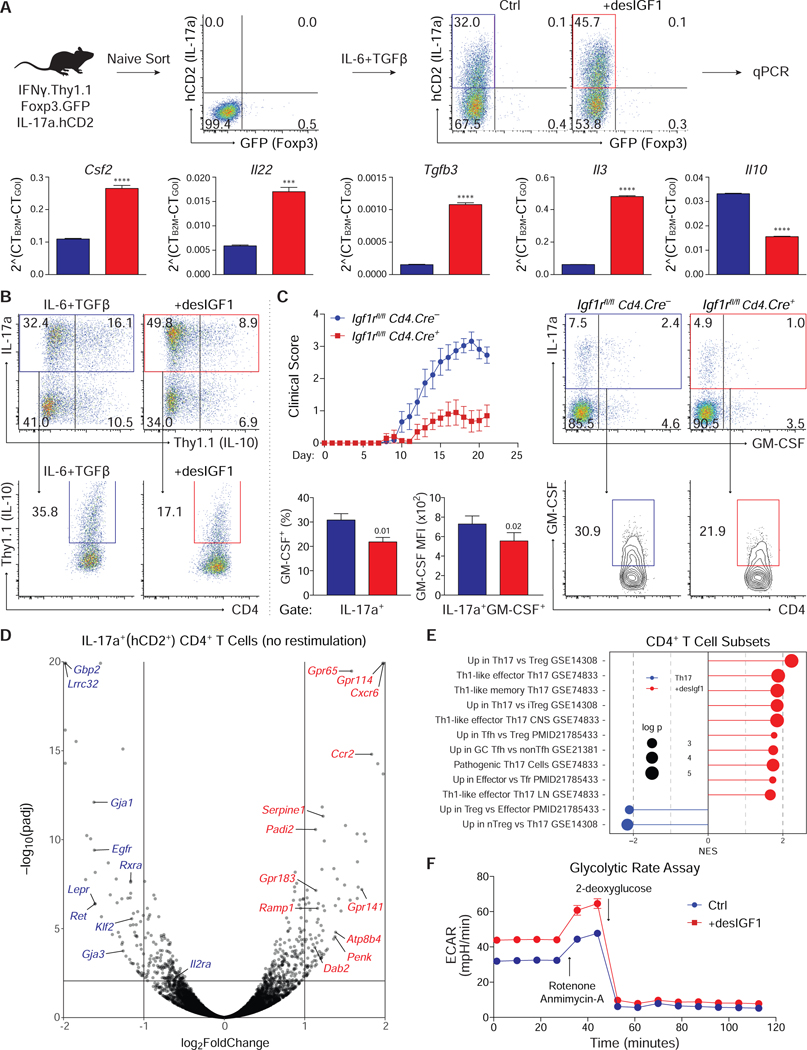
Figure 6. Insulin-like growth factors alter the transcriptional, translational and metabolic identity of Th17 cells.
(A) Sorted naive CD4+ T cells from IFNγ.Thy1.1-IL-17a.hCD2-Foxp3.GFP mice were stimulated in Th17 cell conditions with or without 20ng/mL desIGF1. On day 5, cells were re-stimulated for 3 hours with PMA and Ionomycin, and RNA was isolated from sorted IL-17a (hCD2)+ Foxp3 (GFP)– CD4+ T cells. mRNA was analyzed by qPCR. (B) Sorted naive IL-10.Thy1.1 CD4+ T cells were stimulated in Th17 cell conditions without (blue) and with (red) desIGF1 for 5 days. Expression of Thy1.1 was assessed by flow cytometry. Total live CD4+ T cells (top) and IL17a+CD4+ T cells (bottom) are shown. Data for A and B are representative of two experiments each and were analyzed using a student’s t-test. (C) Gender-matched IGF1rfl/fl Cd4.Cre– and Cd4.Cre+ littermates were immunized with MOG peptide to induce EAE. After 21 days, mice were sacrificed and CNS CD4+ T cells were analyzed by flow cytometry for expression of IL17a and GM-CSF. Flow plots depict cell-number controlled concatenated data from one representative experiment. Total (top) and IL17a+ (bottom) CNS CD4+ T cells are shown. Bar graphs depict percent of IL17a+ cells expressing GM-CSF+ (left) and the MFI of GM-CSF among IL17a+GM-CSF+ cells (right). Experiment performed 3 times (WT n=15 KO n=16). (D-F) Sorted naive CD4+ T cells from IFNγ.Thy1.1-IL-17a.hCD2-Foxp3.GFP mice were stimulated in Th17 cell conditions with or without 20ng/mL desIGF1 for 5 days. RNA-seq was performed on RNA isolated from sorted IL-17a (hCD2)+ Foxp3 (GFP)– CD4+ T cells without re-stimulation. (D) Volcano plot displaying all data points satisfying threshold criteria. (E) Gene Set Enrichment Analysis (GSEA) using gene sets generated from publicly available transcriptomic datasets. Gene lists were analyzed for enrichment of curated query gene sets. A positive Normalized Enrichment Scores (NES) indicate the gene sets are enriched in desIGF1-treated cells (red) or control cells (blue). Adjusted p-values are indicated by diameter (see key, and extended methods for details). (F) Extracellular acidification rate (ECAR) trace of glycolytic rate assay (GRA) performed on Th17 cells generated as in D without (blue) and with (red) desIGF1. Measurements were performed prior to (basal) and following sequential addition of rotenone and antimycin-A (R+A; 1/10 μM), and 2-deoxyglucose (2-DG; 50 mM). Data are representative of three independent experiments. See also Supplementary Fig. S6.

