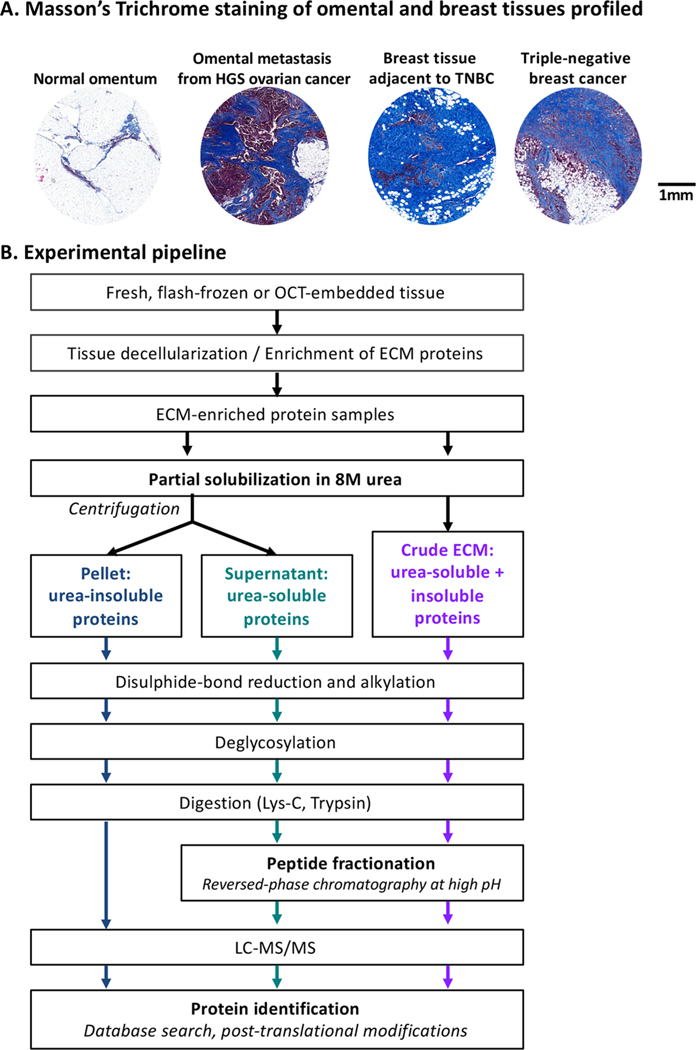
Figure 1.
Experimental pipeline. (A) Masson’s trichrome staining (blue) highlight fibrillar collagen content of the four tissues profiled in this study. (B) Experimental pipeline. A description of the samples analyzed in this study is presented in Supplementary Table S1A.

