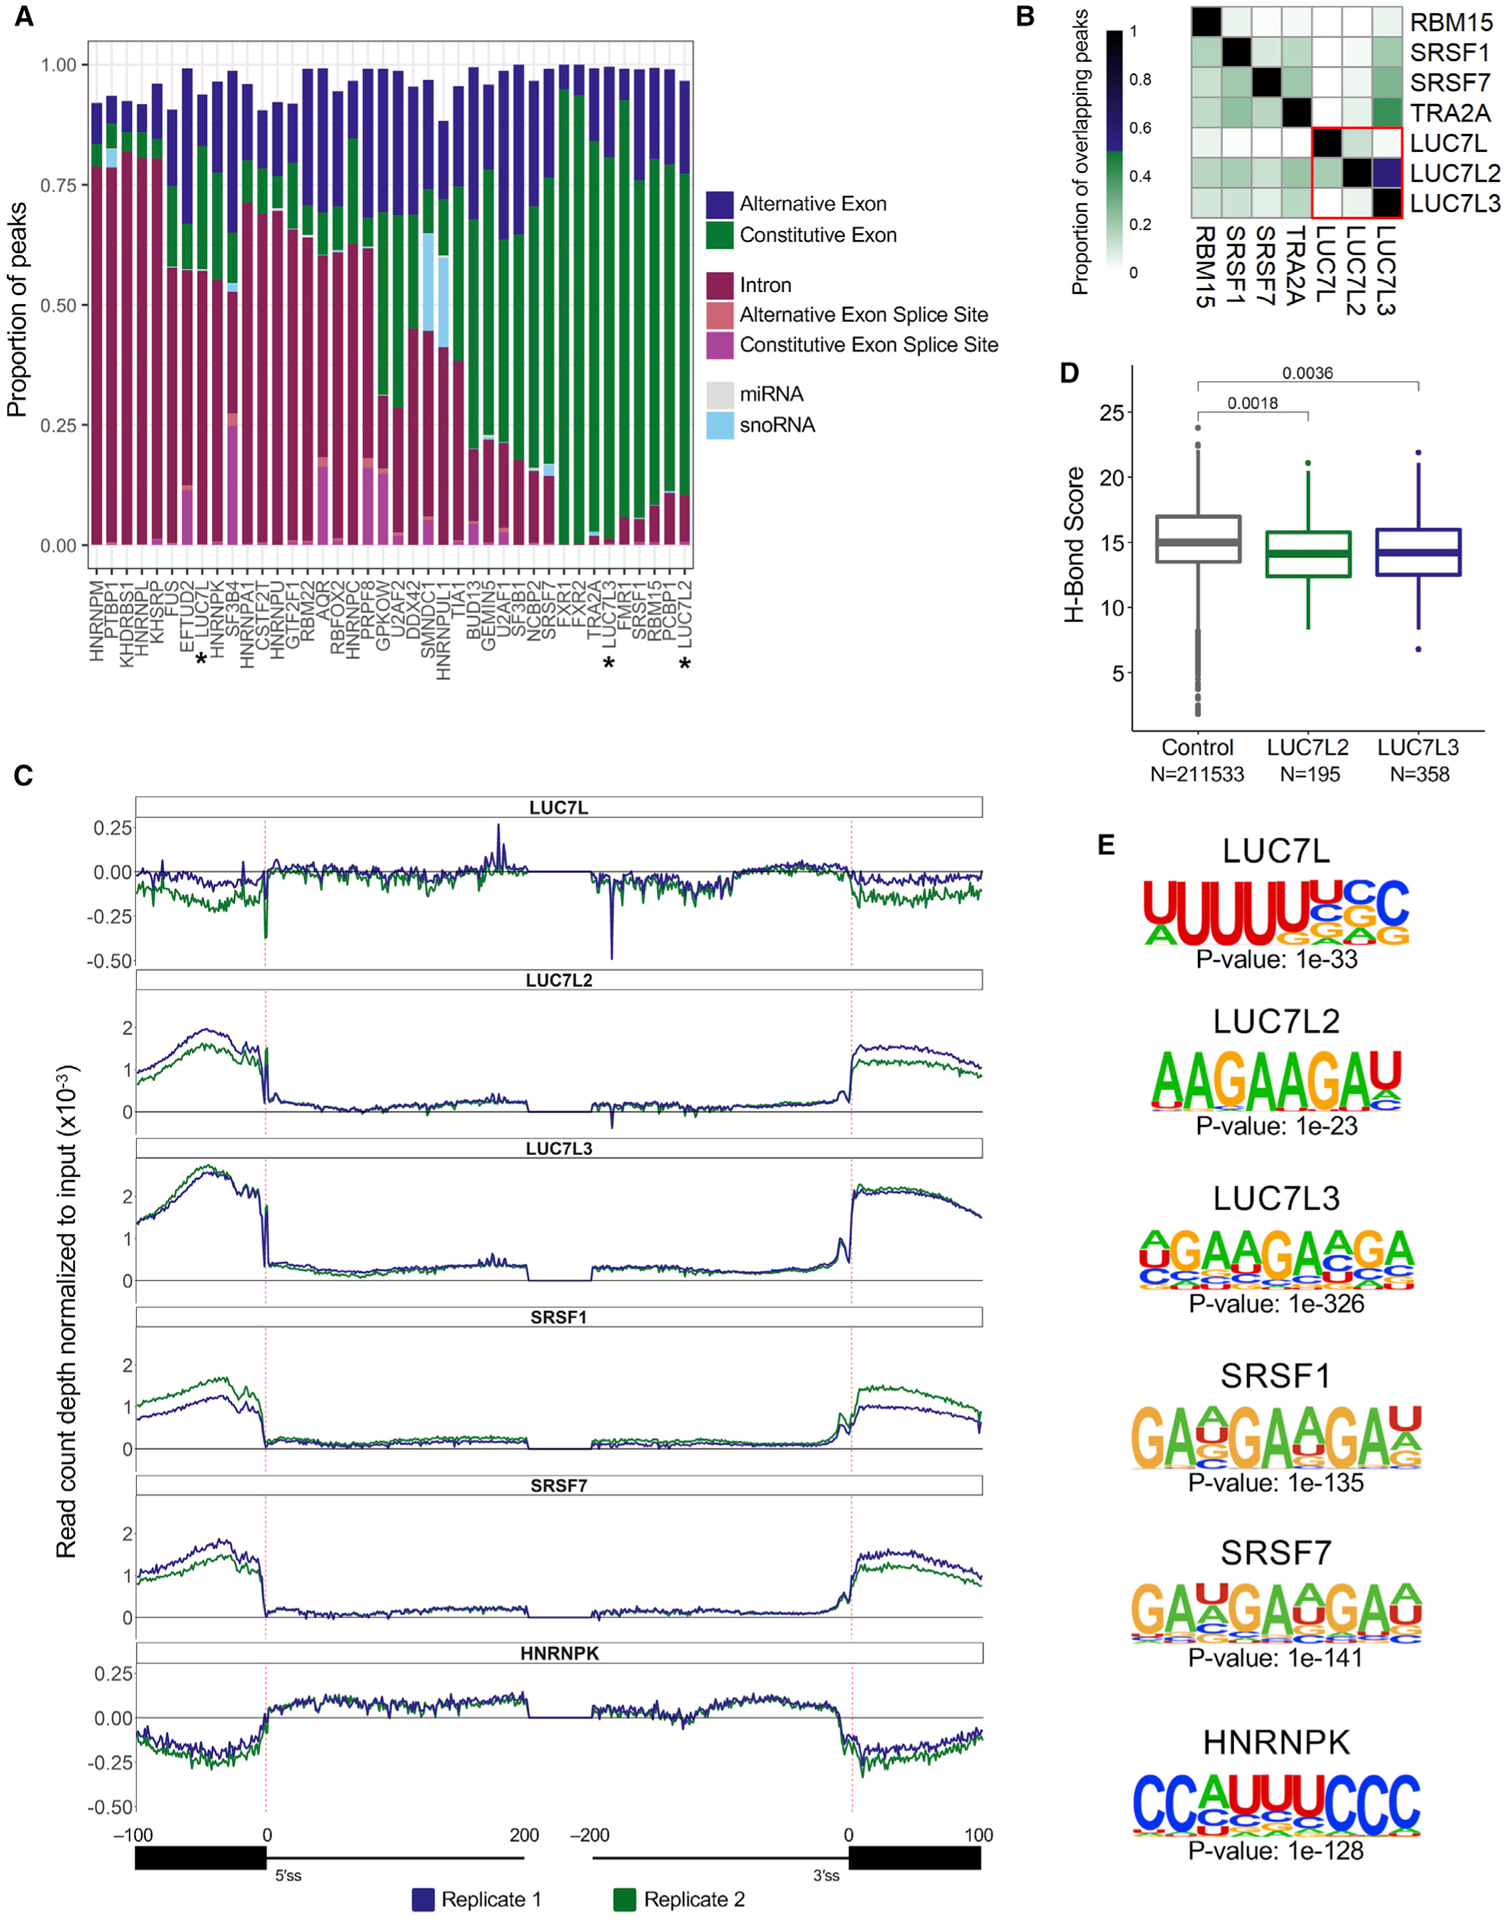
Figure 2. CLIP-seq assays reveal common and distinct RNA binding sites.

(A) Proportion of significant CLIP peaks (log2 fold change [FC] ≥ 3; −log10 p ≥ 3; IDR ≤ 0.01) that overlap a transcriptomic feature.
(B) ENCODE CLIP-seq experiments that have ≥ 10% CLIP peak overlap with at least one of the LUC7-like proteins.
(C) The distribution of LUC7-like crosslink sites, normalized to input crosslink sites at each nucleotide of all annotated human splice junctions. Depicted are binding data for 100 nucleotides into the exon and 200 nucleotides into the intron downstream and upstream of the 5′SS and 3′SS, respectively. Values above the 0-y-axis threshold depicted by a bold black line have enriched binding over the input control.
(D) U1 snRNA/5′SS hydrogen bonding score using the H-Bond tool (Freund et al., 2003). Control group contains all 5′SSs used in CLIP-seq mapping. LUC7L2 and LUC7L3 groups contain 5′SSs where there is an enriched crosslinking site at either position −1 or +1. A Wilcoxon rank-sum test was performed to compute p values.
(E) Binding motifs enriched in the significant CLIP peaks identified in the LUC7-like seCLIP-seq and ENCODE CLIP-seq experiments.
