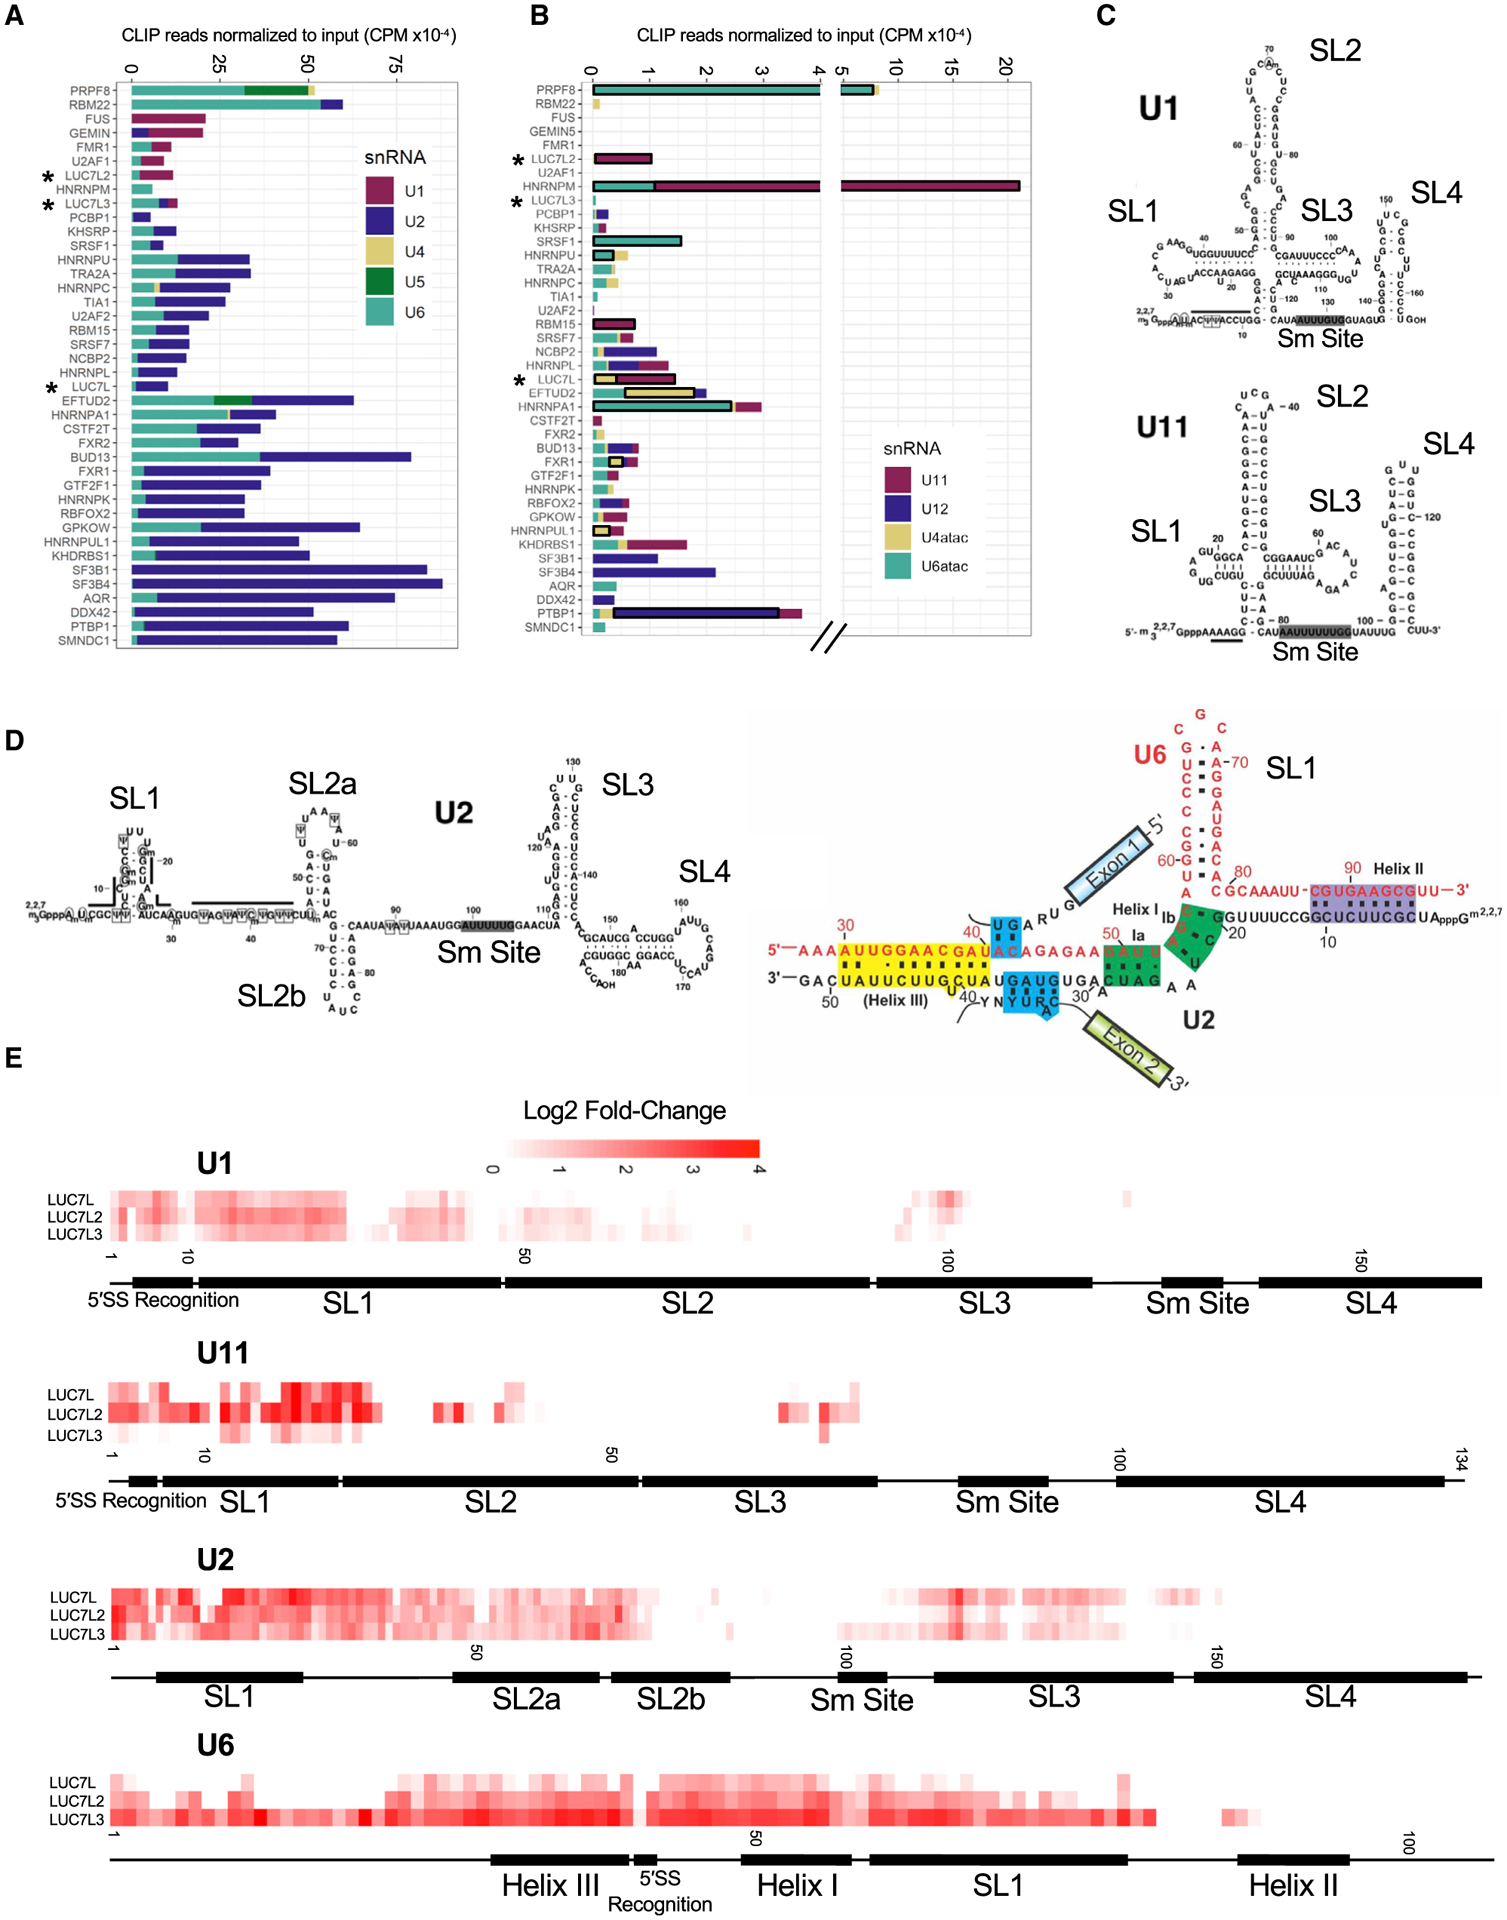
Figure 3. LUC7-like family members bind snRNAs, including the 5′ ends of U1 and U11 snRNAs.

(A) The number of CLIP reads (normalized for library size) enriched over the input control in counts per million (CPM) that map to each major spliceosomal snRNA.
(B) The number of CLIP reads (normalized for library size) enriched over the input control in CPM that map to each minor spliceosomal snRNA. Significantly enriched minor snRNAs are boxed in black. snRNA enrichment was considered significant if the normalized minor snRNA was above the 90th percentile of the distribution in both experimental replicates for each RBP (see STAR Methods).
(C) Secondary structures of U1 and U11 snRNAs with labeled domains (modified from Zhao et al., 2018).
(D) Secondary structures of U2 snRNA (left) and U2/U6 snRNA interactions in the B complex of the spliceosome (right) with labeled domains (modified from Turunen et al., 2013; Zhao et al., 2018).
(E) Single-nucleotide resolution crosslinking maps for the LUC7-like proteins on U1, U11, U2, and U6 snRNAs shown as the averaged replicate log2 fold change enrichment over the input control.
