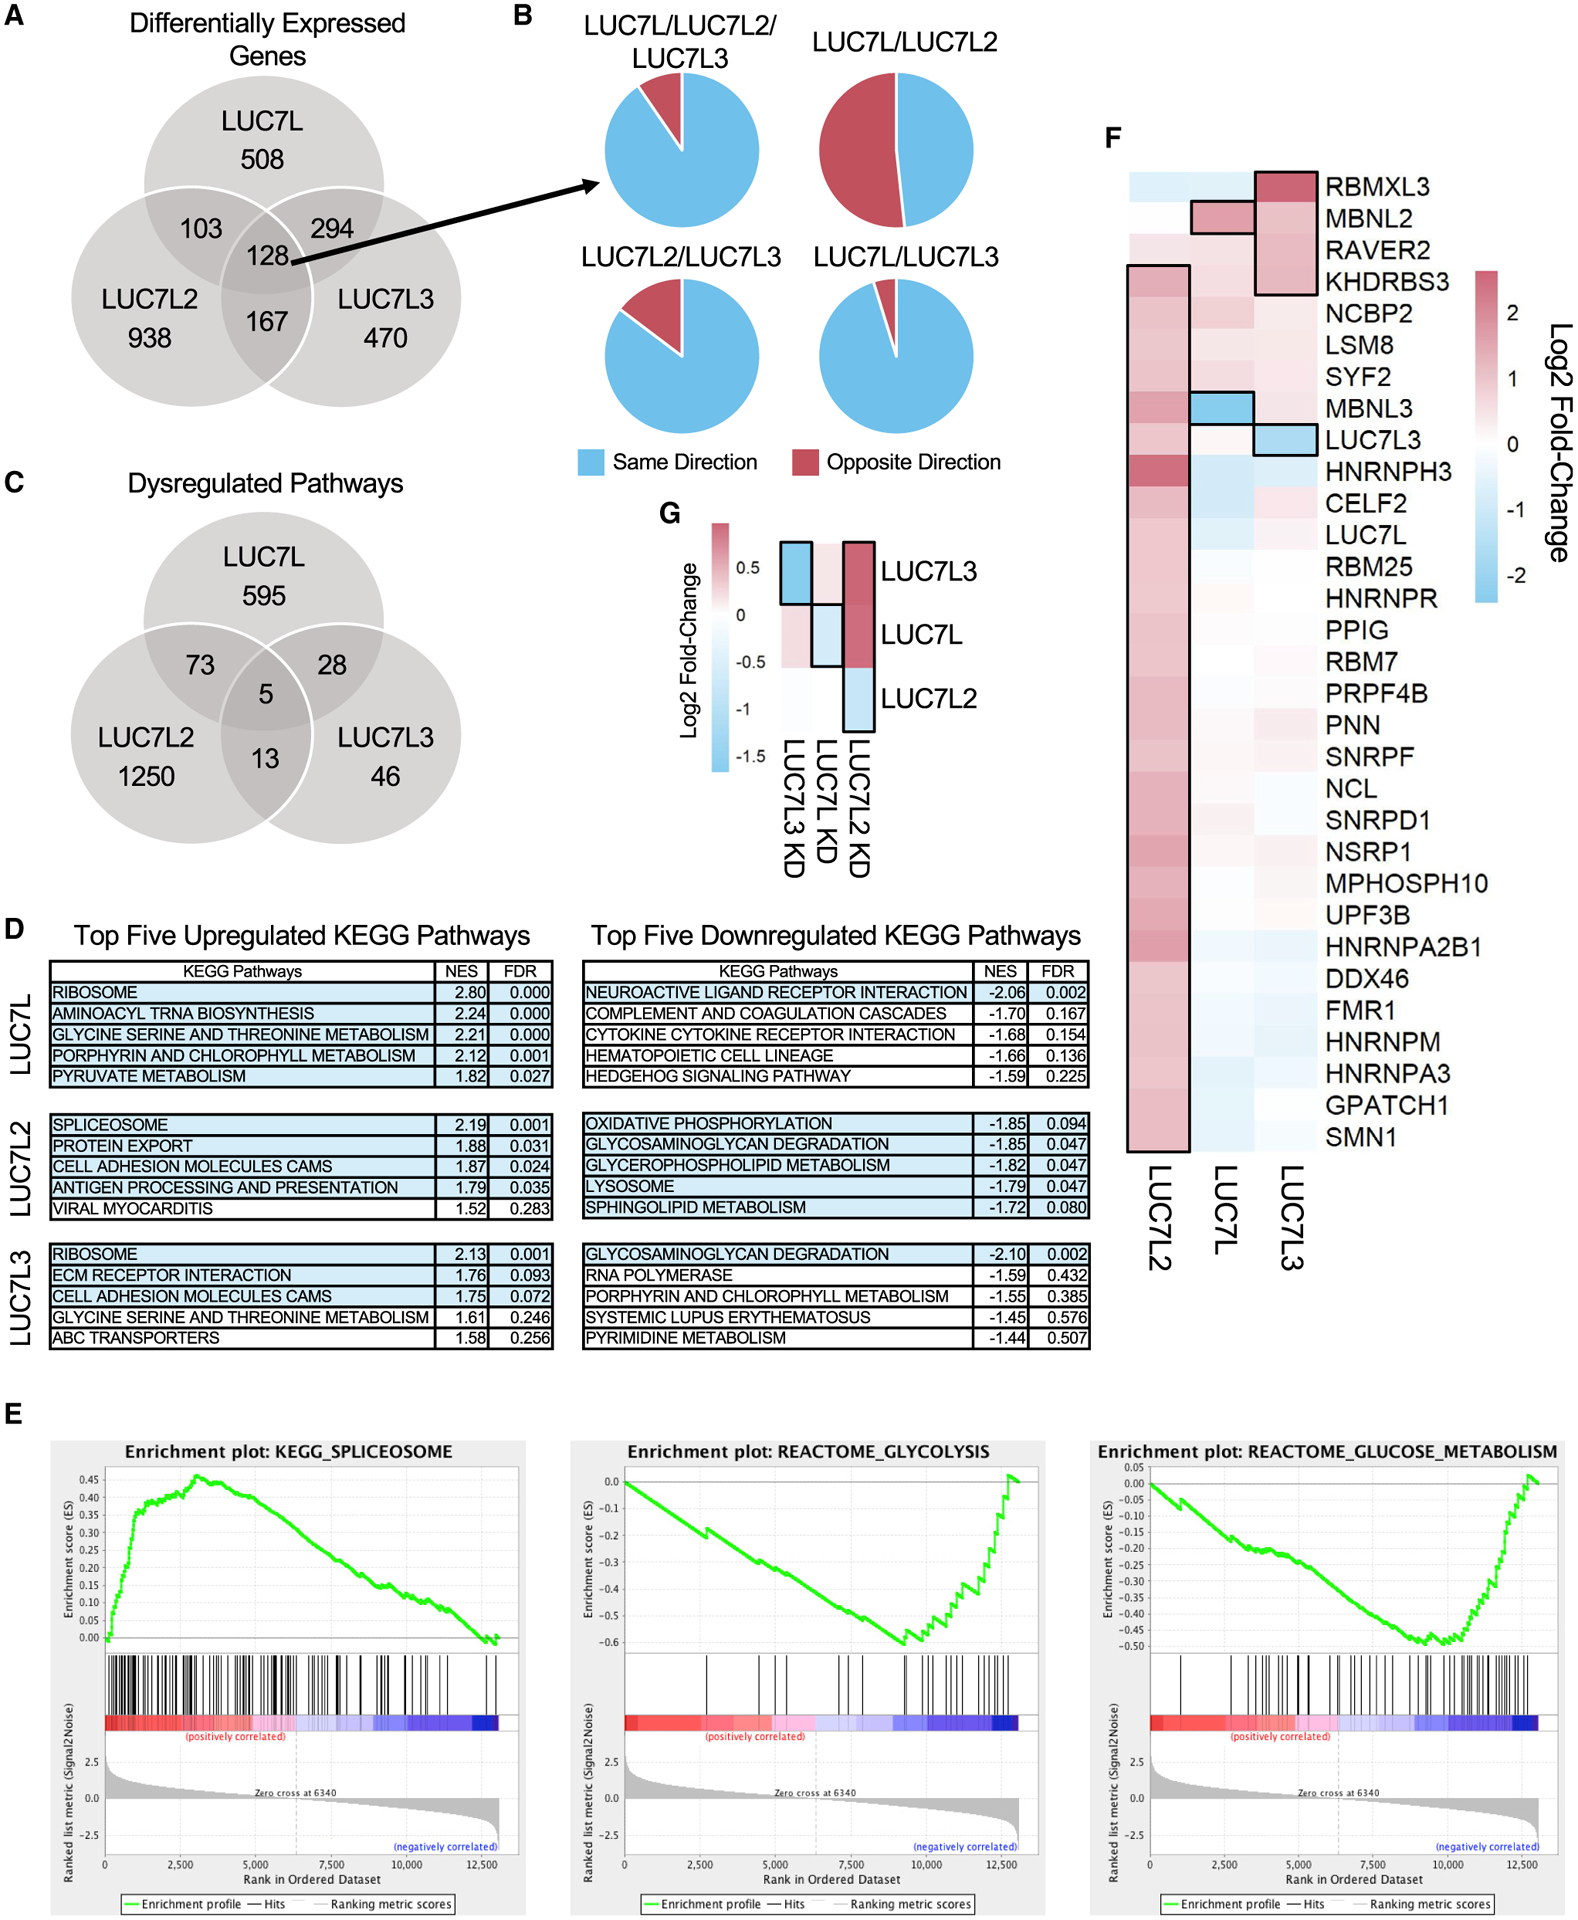
Figure 6. Differential gene expression patterns in the LUC7-like KDs.

(A) Number of common and distinct significant differentially expressed genes in the LUC7-like KD cell lines (log2FC ≥ 1 or ≤ −1; FDR ≤ 0.05) compared to those of the shGFP control.
(B) Direction and proportion of the commonly differentially expressed genes shared between two or more LUC7-like KD cell lines depicted in (A).
(C) Overlap of significant GSEA pathways (FDR ≤ 0.05).
(D) Top five upregulated and downregulated KEGG pathways by normalized enrichment score (NES) identified by GSEA. Rows highlighted in light blue depict significant pathways with an FDR ≤ 0.1.
(E) GSEA enrichment plots of spliceosomal and glycolytic gene sets in the LUC7L2 KD that are significantly upregulated and downregulated, respectively. Genes are ranked by most upregulated in the LUC7L2 KD dataset at the far-left red bar to most downregulated at the far-right blue bar. The vertical black lines indicate where members of the gene set being tested fall on the ranked list. The green line is the running enrichment score that increases if a gene is identified in the ranked list that is in the gene set or decreases if it is not.
(F) Significantly differentially expressed SFs are boxed with a black outline (log2FC ≥ 0.9 or ≤ −0.9; FDR ≤ 0.05) in the LUC7-like KD experiments and clustered by similarity using unsupervised hierarchical clustering.
(G) Expression of the LUC7-like genes. Genes boxed with a black outline depict significantly differentially expressed genes in each specific LUC7-like KD (log2FC ≥ 0.6 or ≤ −0.6; FDR ≤ 0.05).
