
Figure 2. Single-cell RNA seq of murine PDAC identifies 56 cancer cell phenotypes across the EMT spectrum.
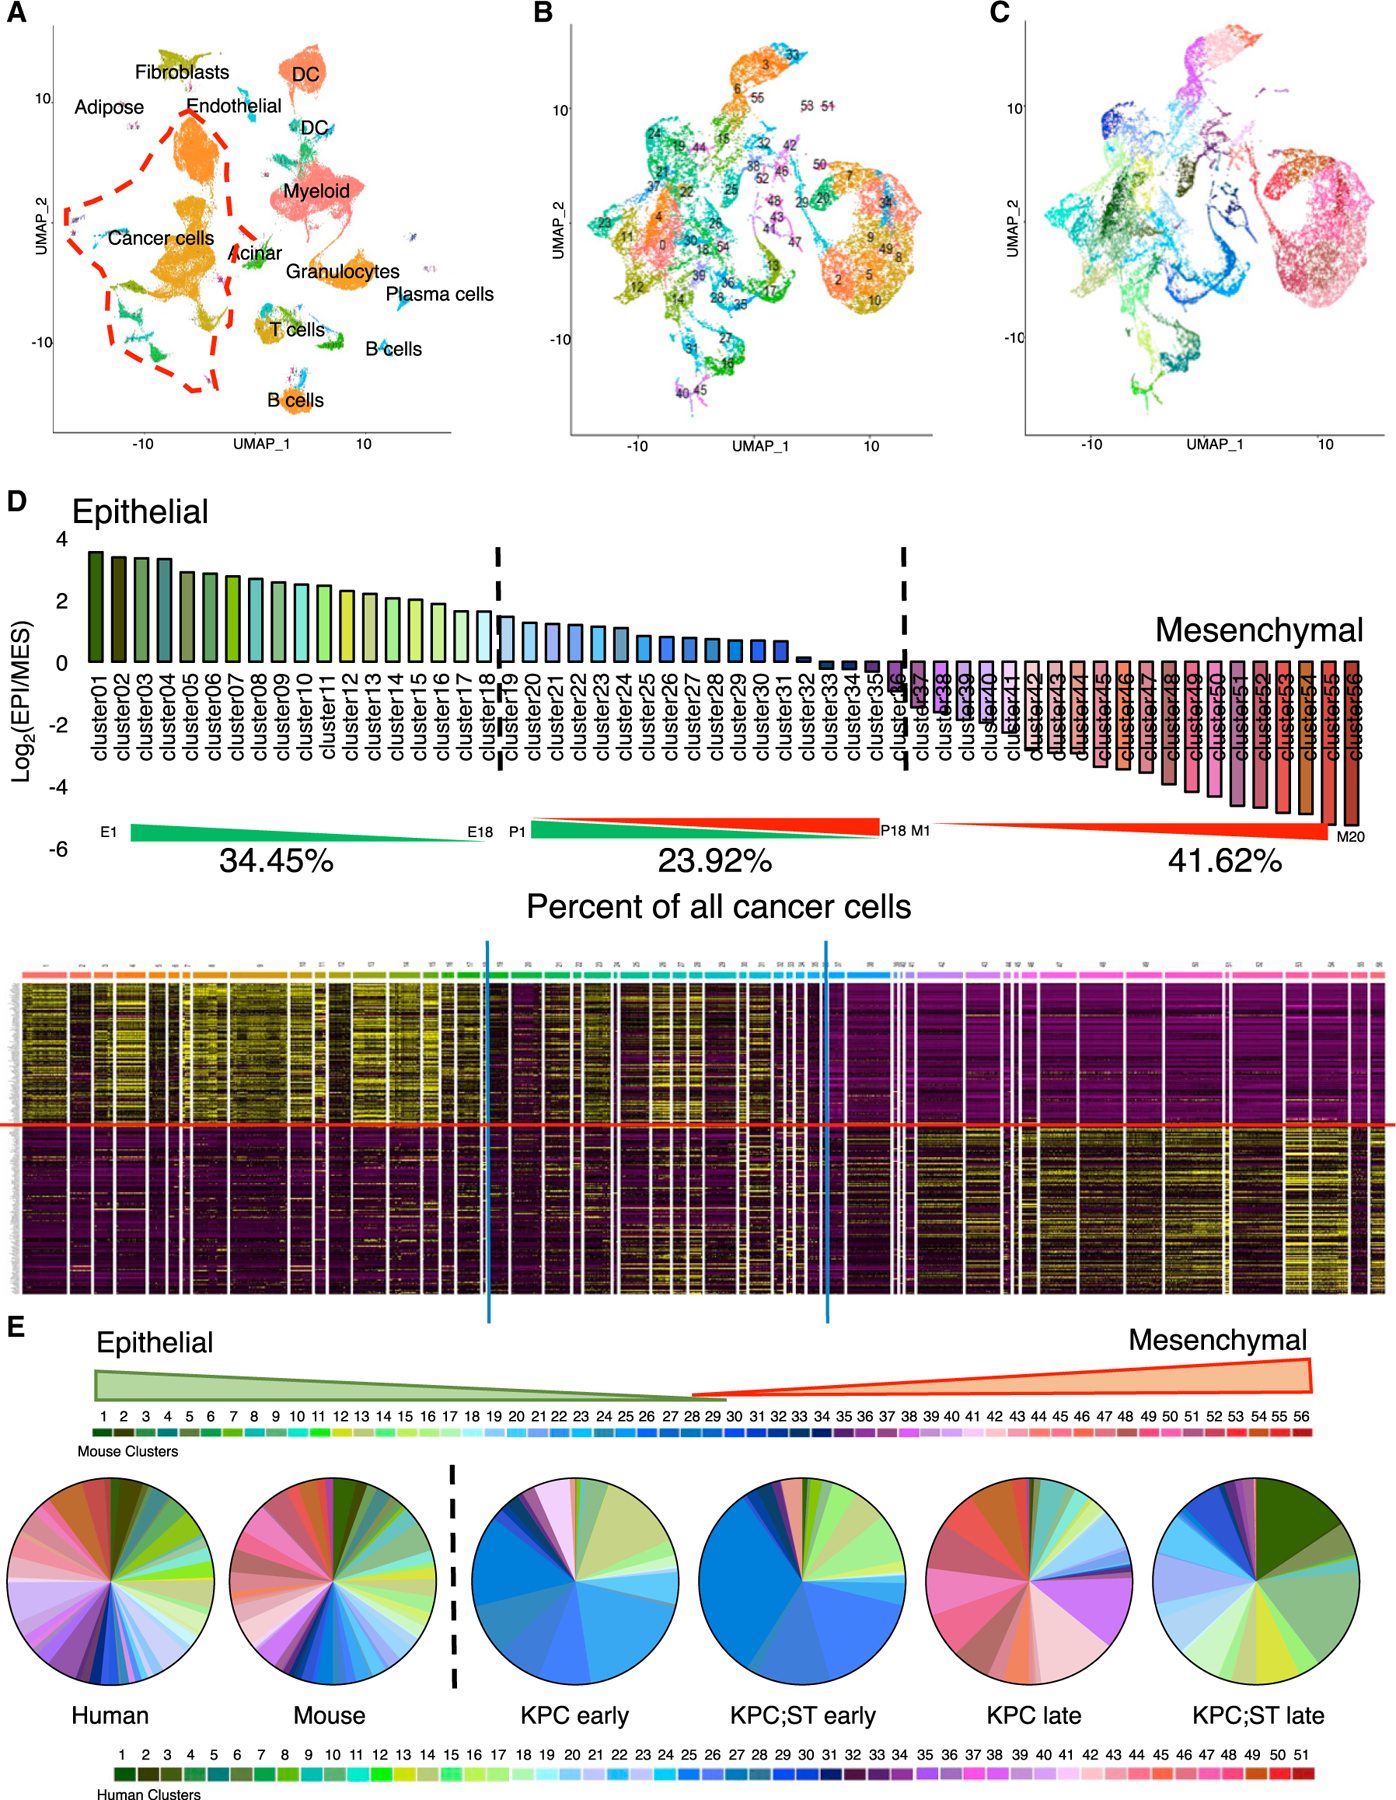
(A) Seurat UMAP clustering of whole-tissue single-cell populations. The red dashed line highlights the cancer cells isolated for further analysis.
(B) UMAP clustering of murine pancreatic cancer cells post-MAGIC using the Thiery EMT signature. (C) Same as (B), recolored to reflect the E/M score.
(D) E/M score for each cluster and corresponding expression heatmap of the Thiery EMT signature. Epithelial genes are above the red line. The blue line indicates the chosen cutoff between epithelial, partial, and mesenchymal groups, with the aggregated percentage of cancer cells indicated.
(E) Pie charts for the percentage of cancer cells in each E/M phenotype for aggregated human and mouse and each experimental mouse cohort. See also Figure S2.