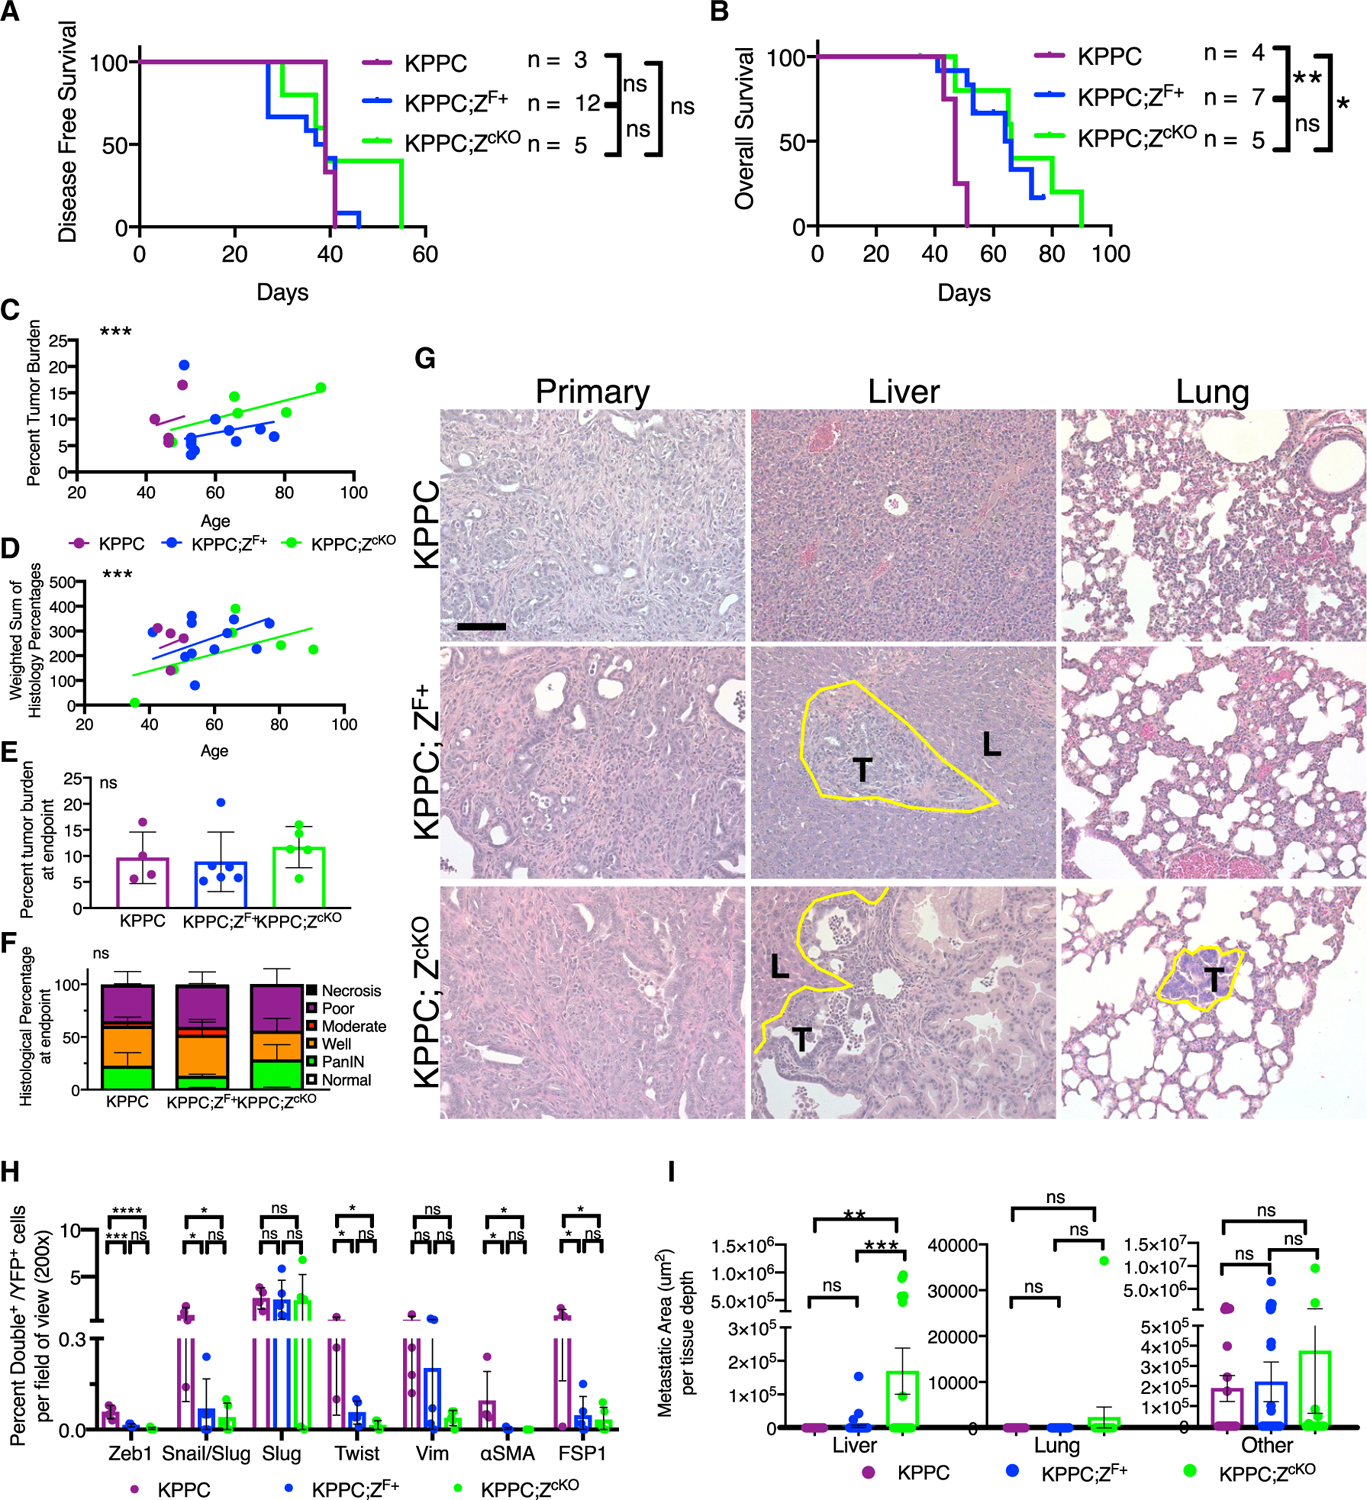
Figure 6. Epithelial stablization via Zeb1 ablation also enhances liver metastasis.

(A) Disease-free survival curve of KPPC (n = 3), KPPC;ZF/+ (n = 12), and KPPC; Zeb1cKO(n = 5) mice as determined by first palpable pancreatic nodule.
(B) Overall survival of KPPC (n = 4), KPPC;ZF/+ (n = 7), and KPPC; ZcKO(n = 5) mice. Log-rank tests.
(C) Percentage of tumor burden (tumor-bearing pancreas weight/body weight) in grams plotted by age of necropsy (n = 4, 11, 5 mice, respectively); lines represent linear regression.
(D) Weighted sum of pathology scores for each mouse plotted by age of necropsy (n = 4, 7, and 5 mice); linear regression line.
(E) Percentage tumor burden of endpoint mice (n = 4, 6, 5 mice, respectively).
(F) Relative percentages of epithelial tumor histology of endpoint mice (n = 4, 7, 5 mice, respectively), two-way ANOVA.
(G) Representative histological micrographs (200×) stained with H&E of primary pancreatic tumors and liver and lung tissues. The yellow line outlines the border of metastatic lesions. T marks tumor area, and L marks liver or lung, respectively.
(H) Quantifications of the percentage of double positive out of YFP+ cells per field of view (200× magnification) of primary pancreatic tumors (n = 4, 5, and 5 mice, respectively) and indicated mesenchymal markers: Snail/Slug, Slug, Twist, Zeb1, Vimentin, αSMA, or FSP1. SEM, ANOVA.
(I) Quantification of the metastatic area per tissue depth for liver (KPPC, n = 16 depths, 4 mice, KPPC;ZF/+, n = 48 depths, 12 mice, and KPPC; ZcKO, n = 20 depths, 5 mice), lung (KPPC, n = 12 depths, 4 mice, KPPC;ZF/+, n = 36 depths, 12 mice, and KPPC; ZcKO, n = 15 depths, 5 mice), and other tissues (KPPC, n = 50 depths, 4 mice, KPPC;ZF/+, n = 72 depths, 12 mice, and KPPC; ZcKO, n = 30 depths, 5 mice). Unless otherwise specified, data are presented as means ± SDs, scale bar: 100 μm, and significance determined by a one-way ANOVA. ns, not significant, *p < 0.05, **p < 0.01, ***p < 0.001, ****p < 0.0001.
See also Figure S6.
