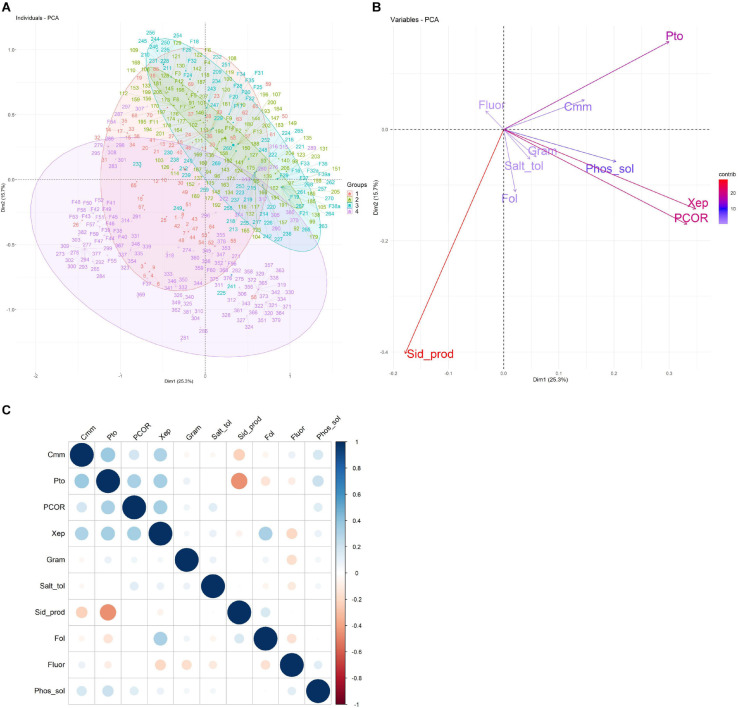
FIGURE 4.
Principal component analysis (PCA) of the characteristics related to the collection of 424 bacterial isolates. (A) The first two principal components are shown in a biplot, and bacterial isolates are colored according to the farm on which they were isolated. (B) Loading plot of the 10 traits used to compute the PCA, namely, antagonist activity against Cmm, Pco, Pto, Xep, and Fol (Cmm, Pco, Pto, Xep, and Fol), fluorescence on King’s medium B agar (Fluor), Gram reaction (Gram), phosphate solubilization (Phos_sol), salt tolerance (Salt_tol), and siderophore production (Sid_prod). (C) Heatmap of the pairwise correlations between the traits analyzed.

