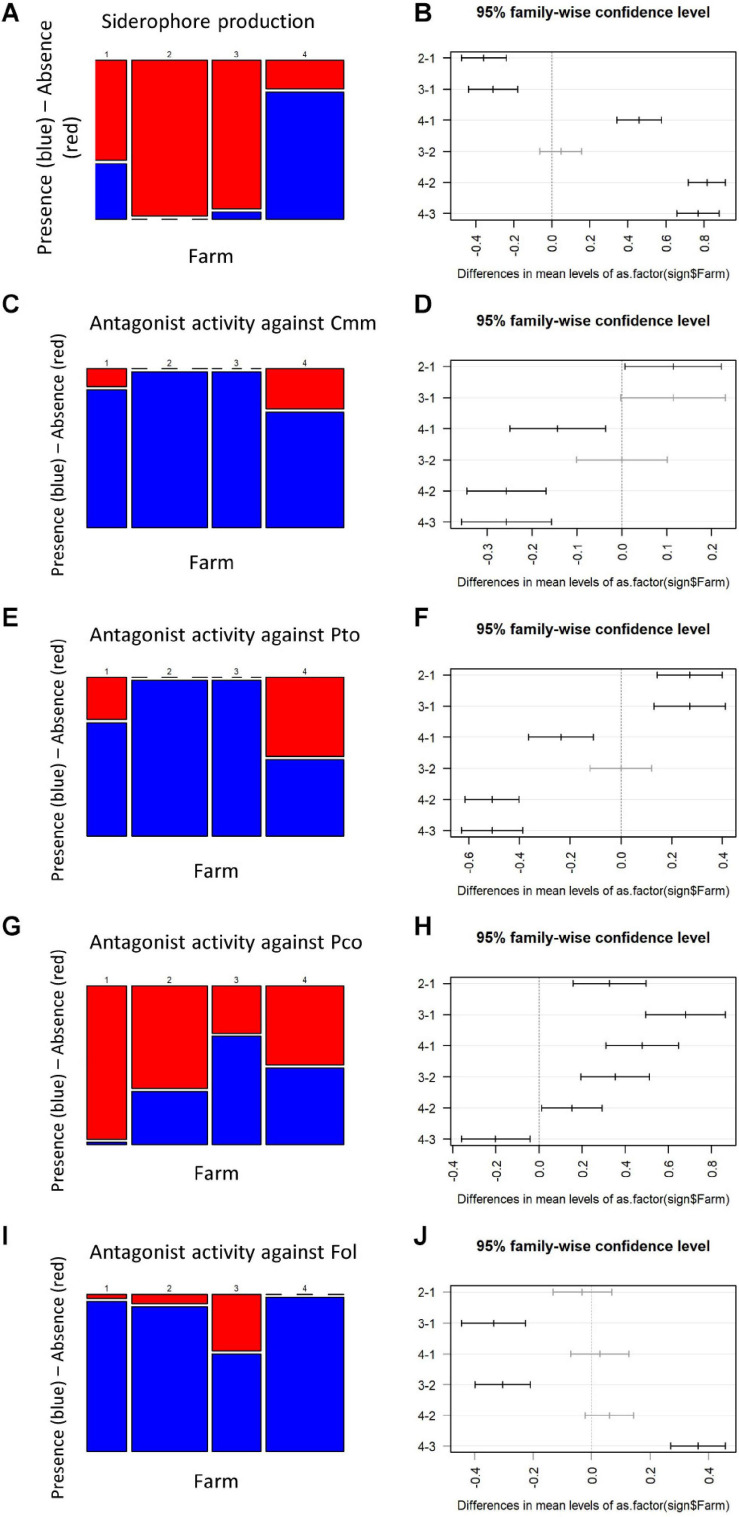
FIGURE 5.
Mosaic plot and Tukey plot of the traits showing the highest differentiation among farms (ANOVA test, p < 0.0001), namely, siderophore production (A), antagonistic activity against Cmm (C), Pto (E), Pco (G), and Fol (I). Mosaic plots [left of the panels (B,D,F,H,J)] show the relative frequency of the presence (blue) or absence (red) of a trait (y-axis) given the farm (x-axis); the width of the columns is proportional to the numerosity of the accessions isolated on each farm. On the right of the panels, the confidence intervals are shown of each pairwise comparison after the Tukey post hoc test. Pairwise comparisons that were not statistically different are shown in gray.

