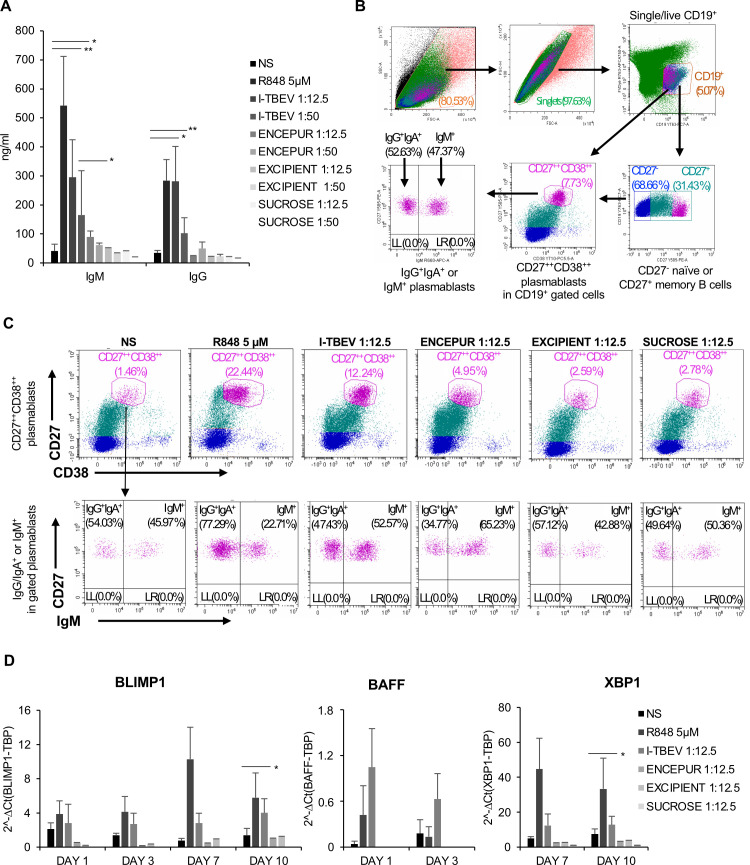
Fig 2. Ig production and B cell differentiation after PBMC stimulation with Encepur and the single vaccine components.
(A) PBMC were stimulated with R848 (5 μM), I-TBEV, Encepur vaccine, excipient and sucrose (dilution 1:12.5 and 1:50) or left untreated (NS). The production of total IgM and IgG was measured by ELISA in supernatants of PBMC cultures stimulated for 10 days. The results shown were mean values ± SEM of 6 independent experiments for IgM and 4 independent experiments for IgG. ANOVA p value for IgM: 0.001; for IgG: 0.015. Sidak adjustment for multiple comparisons was applied to IgM while, LSD (equivalent to no adjustments) was used for IgG. (B) Representative dot plots of flow cytometry gating strategy. PBMC were firstly gated by forward (FSC) and side scatter (SSC) then CD19+ cells were further gated on live cells. Within the B cell population, plasmablasts were identified as CD27++CD38++ expressing IgM or IgG/IgA. (C) The percentage of CD27++CD38++ plasmablasts and IgM+ or IgG+IgA+ plasmablasts was assessed by cytofluorimetric analysis of PBMC stimulated for 10 days with R848 (5 μM), I-TBEV, Encepur vaccine, excipient and sucrose (dilution 1:12.5) or left untreated (NS) as described in B. A representative experiment, out of 5 independent experiments performed, is shown. Numbers in the dot plots are the percentage of live-gated cells positive for CD19+CD27++CD38++ (upper panels). In the lower panels, the percentage of IgM+ or IgG+IgA+ plasmablasts is shown. (D) Relative expression of BLIMP1, BAFF and XBP1 in PBMC left untreated (NS) or stimulated with R848 (5μM), I-TBEV, Encepur vaccine, excipient and sucrose (dilution 1:12.5) for 1, 3, 7 and 10 days was measured by q-PCR analysis. All quantification data are normalized to TBP level by using the equation 2−ΔCt. The results shown were mean relative values ± SEM of 3 independent experiments. Student’s t-test p-value for BLIMP1: *p = 0.03. Student’s t-test p-value for XBP-1: *p = 0.03.

