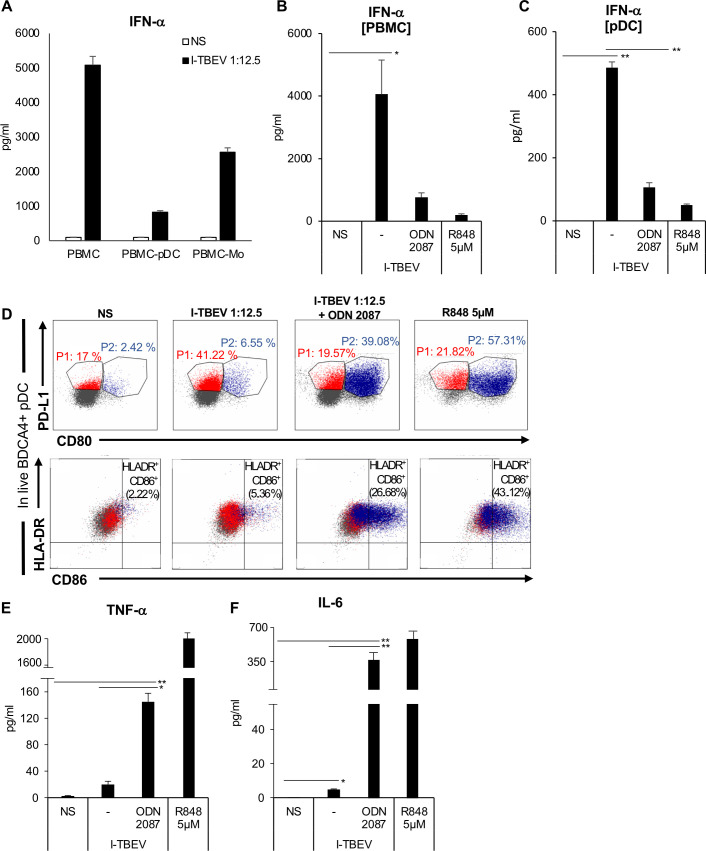
Fig 3. Identification and characterization of cell population responsible for type I IFN production in PBMC.
(A) Total PBMC or PBMC depleted of either pDC (PBMC-pDC) or monocytes (PBMC-Mo) were left untreated or stimulated with I-TBEV for 24 hours. The production of IFN-α was measured in culture supernatants by ELISA. The results shown were mean values ± SEM of 3 independent experiments. (B) PBMC were left untreated (NS) or stimulated with R848 (5 μM) or treated with I-TBEV (1:12.5) alone or in combination with the TLR-7/8 inhibitor, ODN 2087. The production of IFN-α was measured by ELISA in supernatants collected after 24 hours. The results shown were mean values ± SEM of 3 independent experiments. ANOVA p value for IFN-α: 0.049. Based on LSD (equivalent to no adjustments). (C-F) Isolated pDC were left untreated (NS) or stimulated for 24 hours with I-TBEV alone or in combination with the TLR-7/8 inhibitor, ODN 2087. The production of IFN-α (C) was measured in culture supernatants by ELISA. The results shown are mean values ± SEM of 3 independent experiments. ANOVA p value for IFN-α: 0.000. Based on LSD (equivalent to no adjustments). (D) Isolated pDC were stained with PD-L1, HLA-DR, CD86, CD80, ILT7, BDCA2 and BDCA4. A total of 50.000 cells were analyzed per sample by flow cytometry to evaluate the percentage of pDC sub-populations in live BDCA4+ pDC. A representative pDC sub-population profile out of 3 different experiments conducted separately is shown: P1-pDC (PD-L1+ CD80-) population is indicated in red, P2-pDC (PD-L1+ CD80+) in blue. The production of TNF-α (E) and IL-6 (F) was tested by cytometric bead assay in 24 hour-collected supernatants. The results shown were mean values ± SEM of 3 independent experiments. ANOVA p value for TNF-α: 0.003; for IL-6: 0.001. Based on LSD (equivalent to no adjustments).

