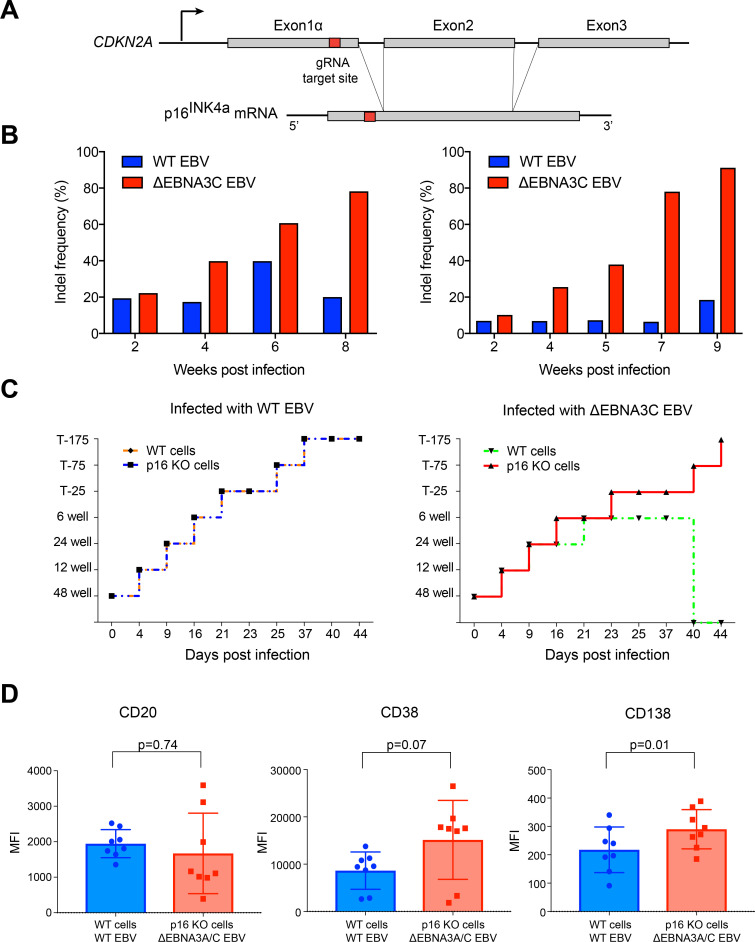
Fig 4. p16INK4a is a functional barrier to EBV driven proliferation of lymphoblastoid cells.
(A) Blueprint of the primary transcript and the spliced mRNA with the three exons of CDKN2A on chromosome 9 encoding the p16INK4a protein. The target site of the RNP complex within the 1st exon (exon1α) (chr9:21,974,678–21,974,827) is shown. (B) Study of the biological effect of the CDKN2A knockout in a time course experiment. WT and p16 KO cells were mixed such that the fraction of the latter was in the order of 10 to 20%, when the cells were infected with WT or ΔEBNA3C EBV strains. The knockout status of the CDKN2A gene was studied by next generation sequencing to analyze the CD46 locus of the mixed cell populations over time. The fraction of cells with a disabled CDKN2A gene increased in cells infected with ΔEBNA3C EBV exceeding 80% after eight weeks, whereas the knockout status of CDKN2A in the population of cells infected with WT EBV did not show a clear trend. Results from two biological replicates are shown, additional replicates can be found in S4A Fig. (C) Cell numbers of four different B cell populations were plotted as a function of days post nucleofection (x-axis) versus the format of the cell culture vessel (y-axis) starting with a single well in a 48-well cluster plate. 2×10⁶ B cells with an intact CDKN2A locus (WT cells) or cells with an edited CDKN2A gene (p16 KO cells) were infected with wild-type (WT) EBV (left panel) or ΔEBNA3C EBV (right panel). WT EBV infected primary human B cells developed into stably expanding lymphoblastoid cell lines irrespective of their p16INK4a status (left panel). ΔEBNA3C EBV infected B cells could be expanded until about six weeks p.i., when cells with an intact CDKN2A gene ceased to proliferate and were lost eventually (right panel). In contrast, ΔEBNA3C mutant EBV infected p16INK4a negative B cells continued to proliferate beyond this time point. The results were consistent between four different biological replicates. Other replicates are shown in S4B Fig. (D) p16 KO cells infected with ΔEBNA3A/C EBV and WT cells infected with WT EBV were analyzed for CD20, CD38 and CD138 cell surface levels by flow cytometry. The graph summarizes the mean fluorescence intensities (MFI) of CD20, CD38 and CD138 markers of living cells two months post infection. Mean and standard deviation obtained from 8 independent biological replicates are shown. The significance of MFI values of the immunophenotypic surface proteins was calculated using the Wilcoxon matched-pairs signed rank test.

