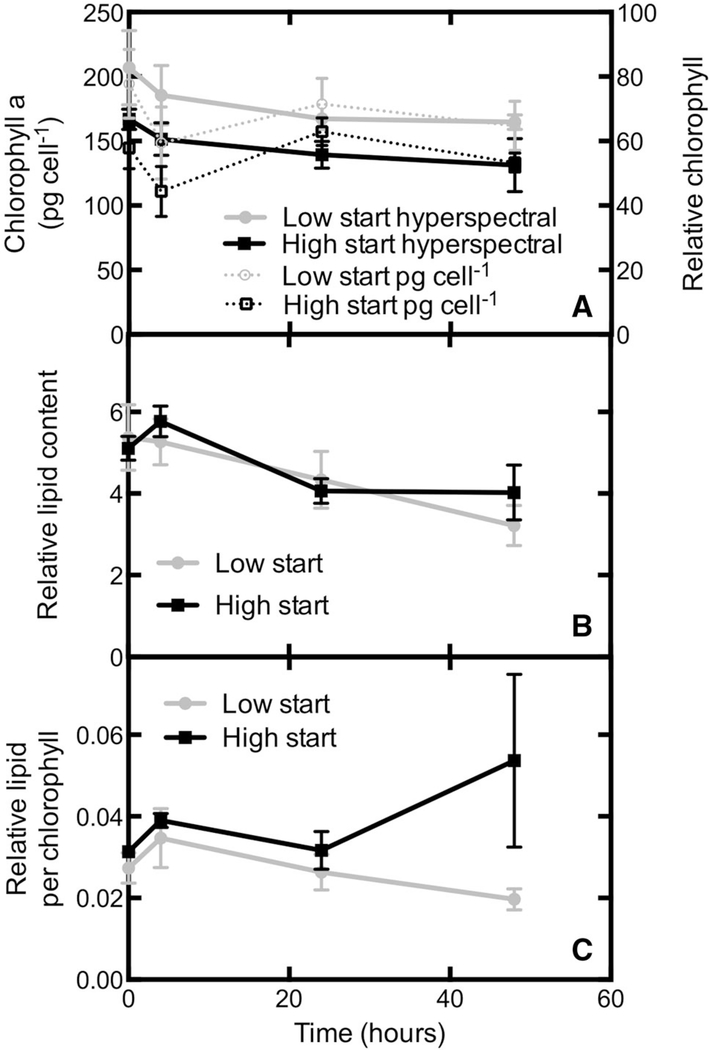
Fig. 10.
Lipid analyses as determined from hyperspectral image analysis of N. salina. a Comparison of the bulk extracted chlorophyll assay with the relative chlorophyll content determent from hyperspectral imaging. b Relative lipid content as determined from hyperspectral imaging analyses. c Ratio of lipid content to chlorophyll content per cell determined from hyperspectral imaging and multivariate curve resolution analyses. Error bars represent the SE of the mean, n = 3

