
Fig. B2.
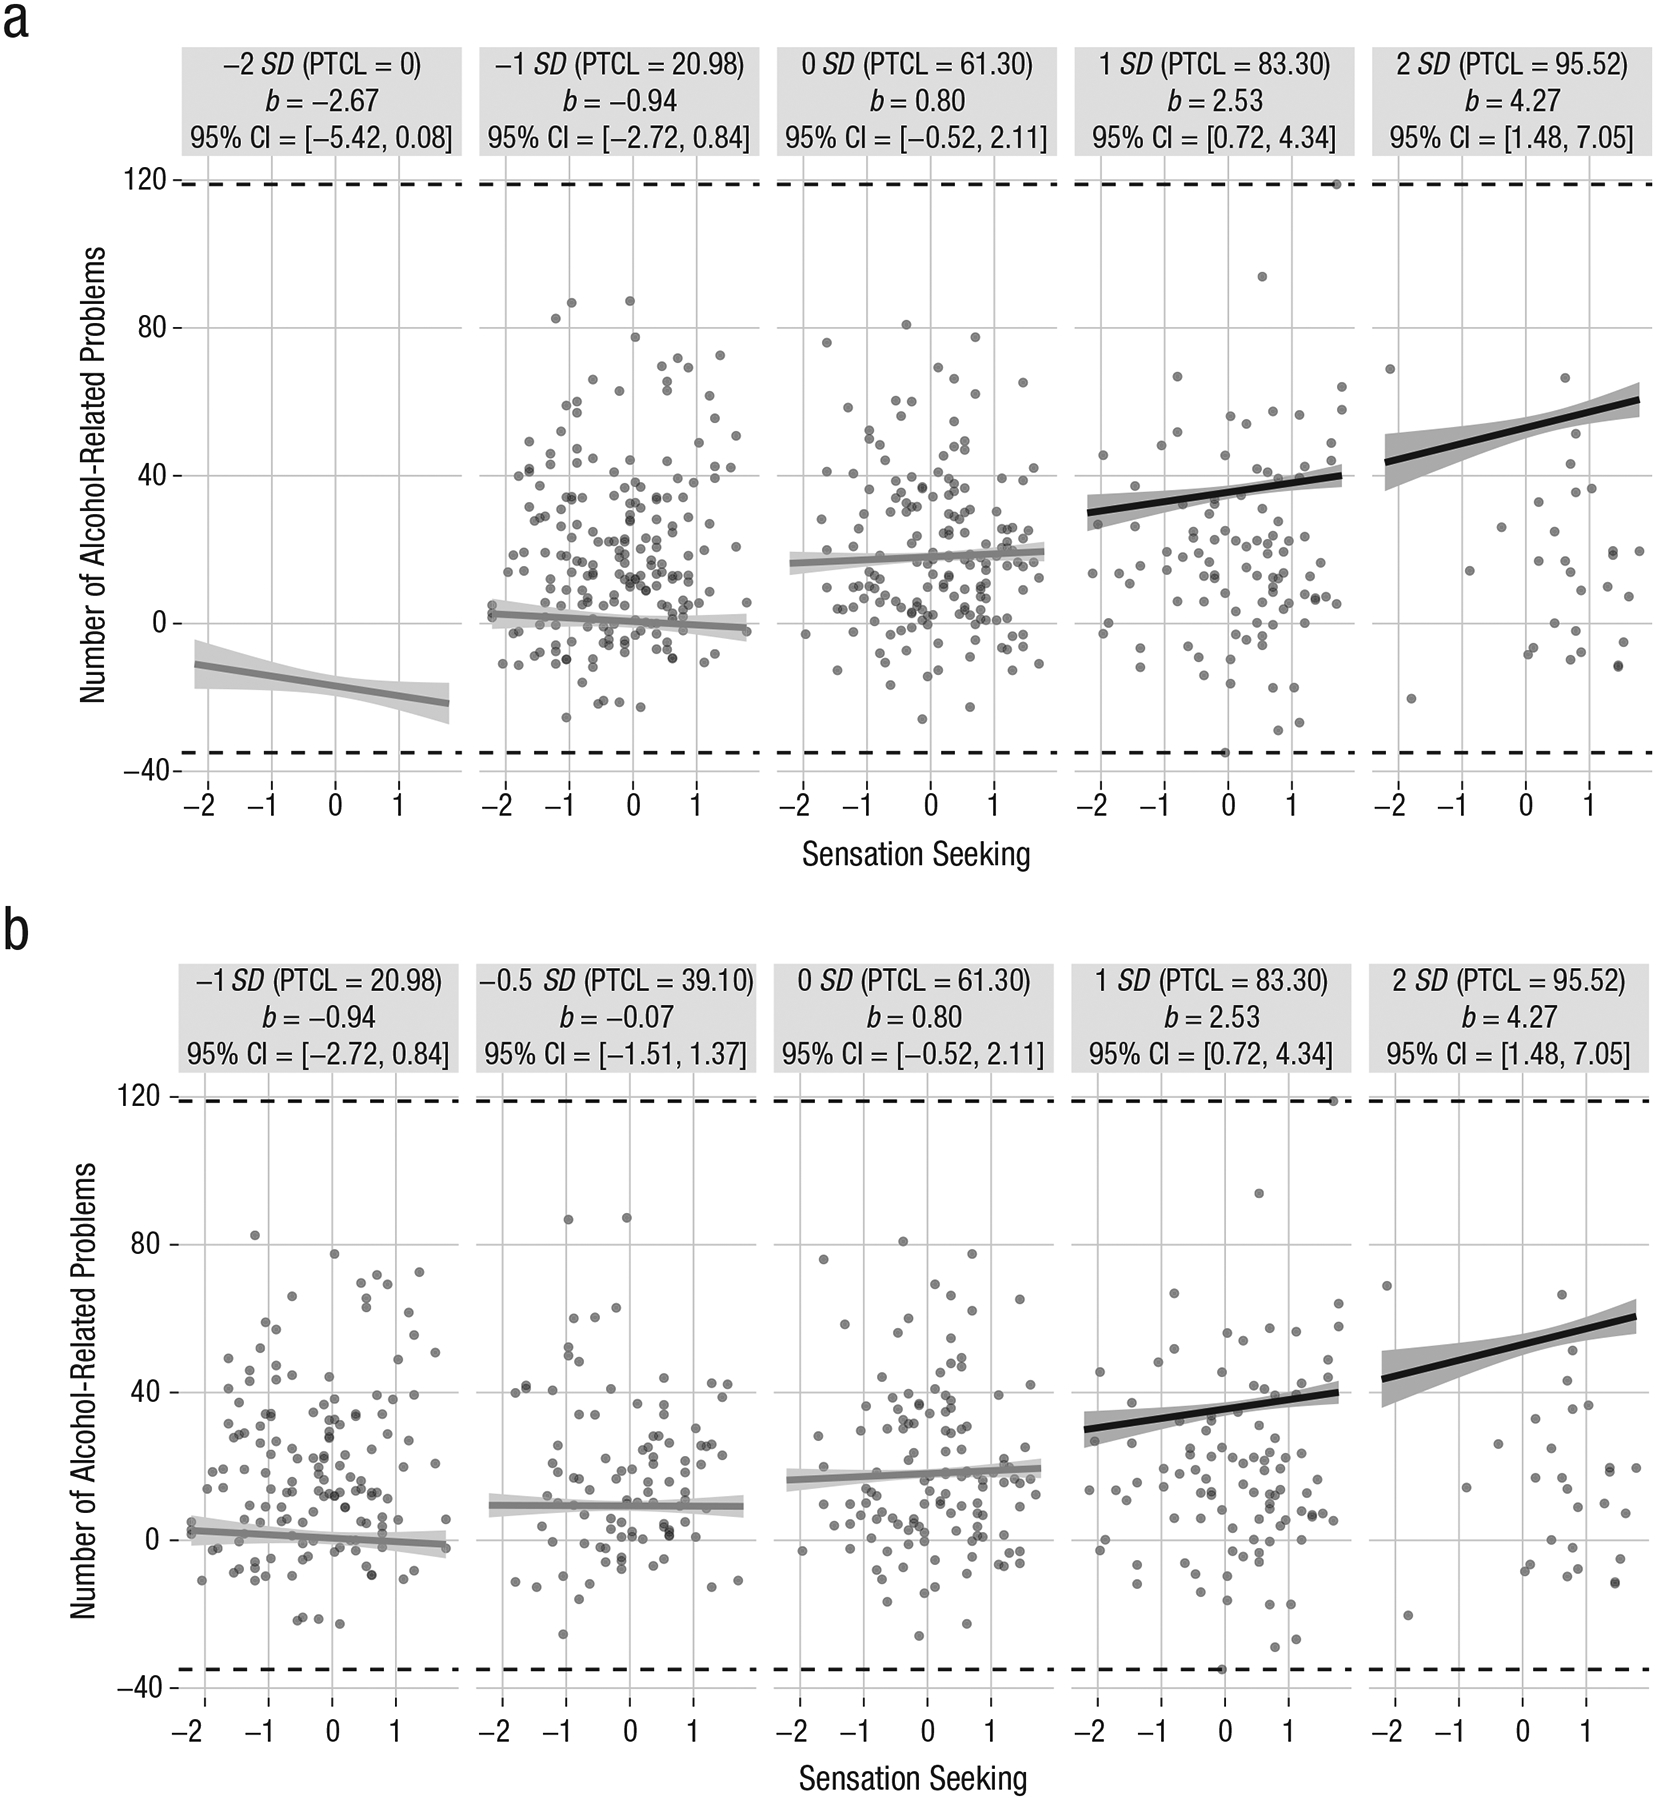
Small-multiples depictions of the interaction effect reported by K. M. King, Karyadi, Luk, and Patock-Peckham (2011), who examined the interactive effect of sensation seeking and alcohol use (the moderator) on the number of alcohol-related problems experienced per year. The small multiples in (a) illustrate the interaction across the range from 2 SD below to 2 SD above the mean of alcohol use. In (b), the small multiples have been tailored to reflect the distribution of the moderator, ranging from 1 SD below to 2 SD above the mean. Each graphic shows the computed 95% confidence region (shaded area), the observed data (gray circles), and the maximum and minimum values of the outcome (dashed horizontal lines). CI = confidence interval; PTCL = percentile.