
Fig. 3.
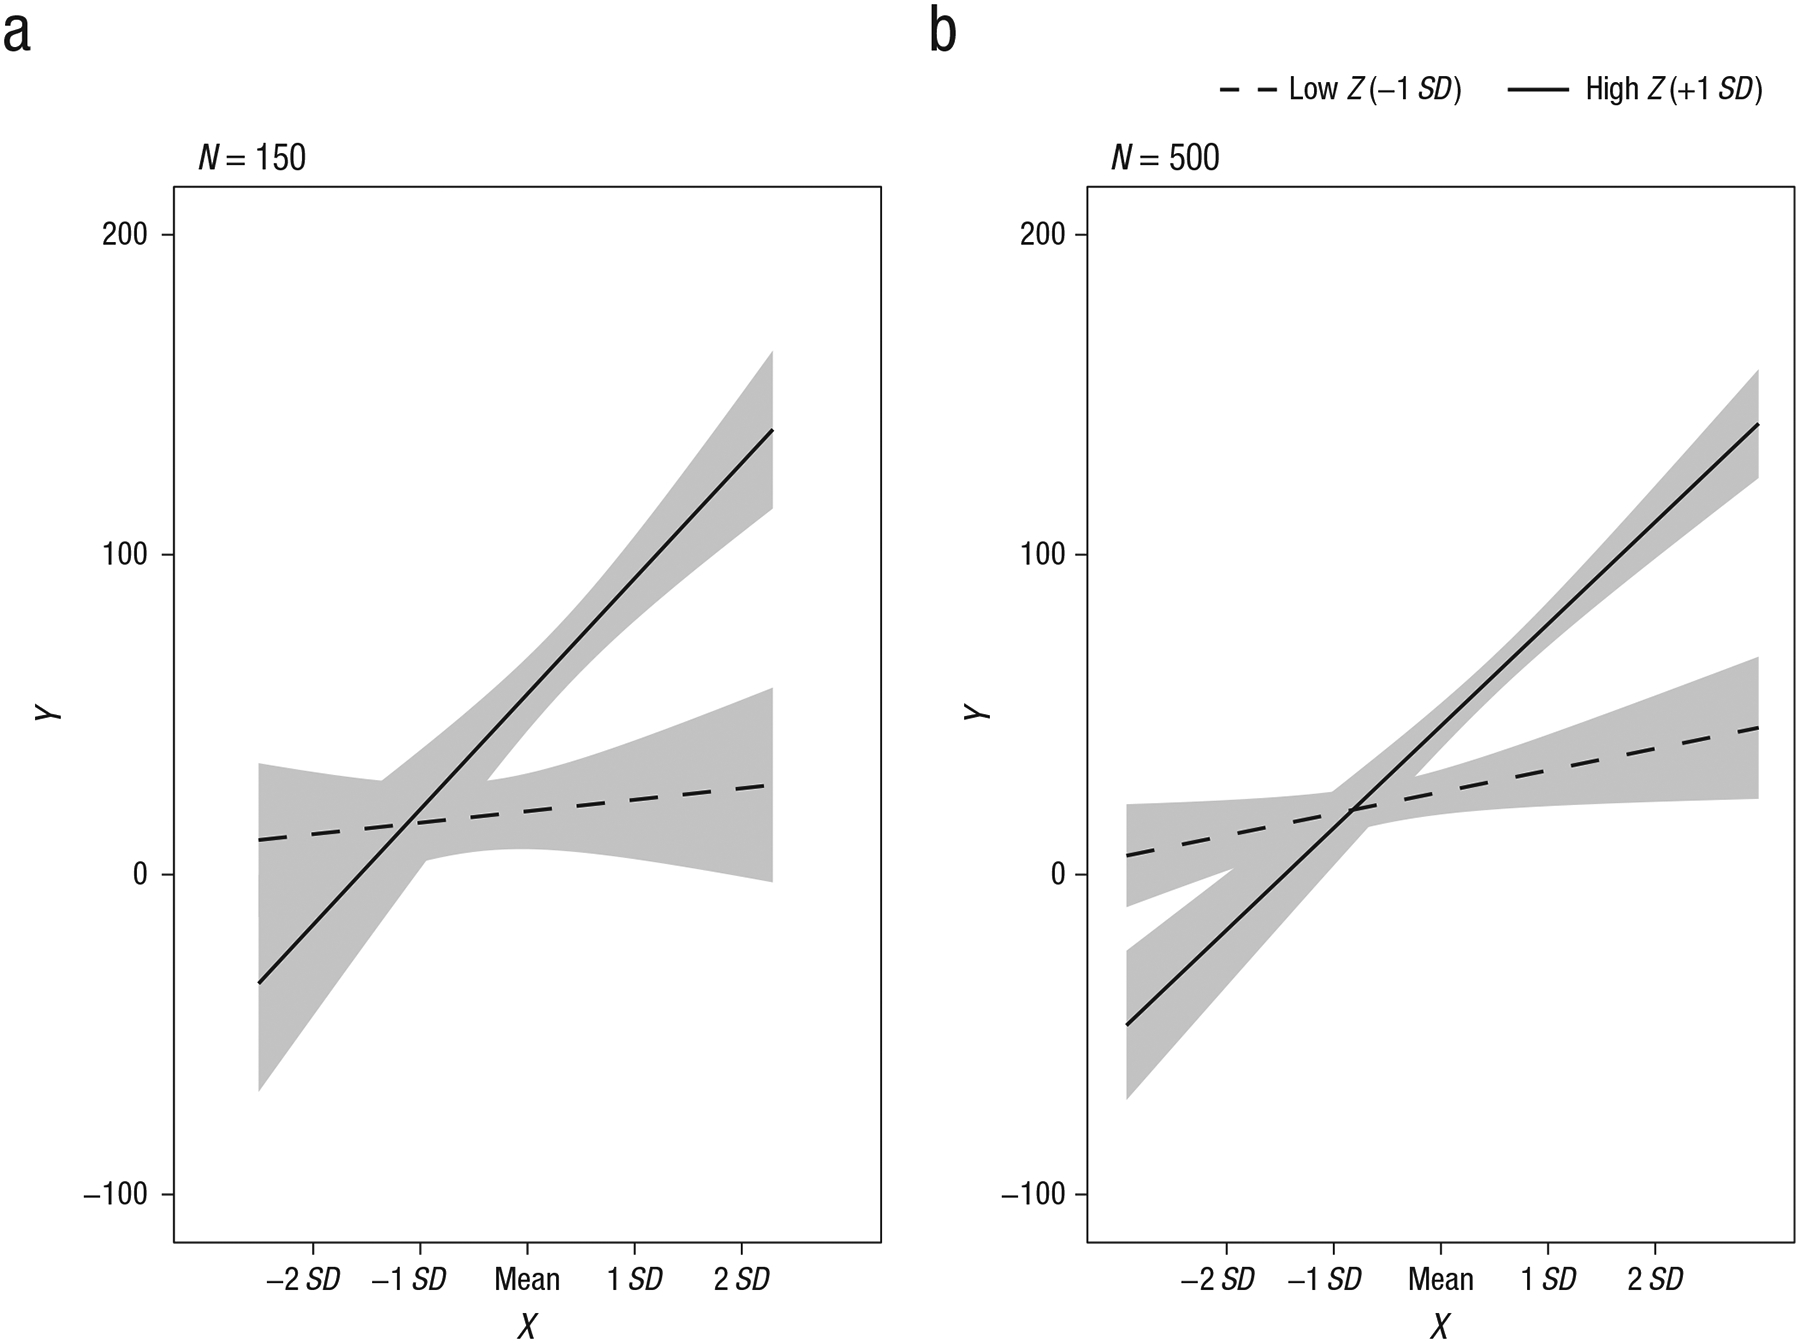
Illustration of the effect of sample size on uncertainty in simple-slopes estimates: simple slopes with 95% confidence regions for (a) the simulated example in Table 1 (N = 150) and (b) the same parameterization with a larger sample size (N = 500). For Z, low refers to 1 SD below the mean, and high refers to 1 SD above the mean.