
Fig. 8.
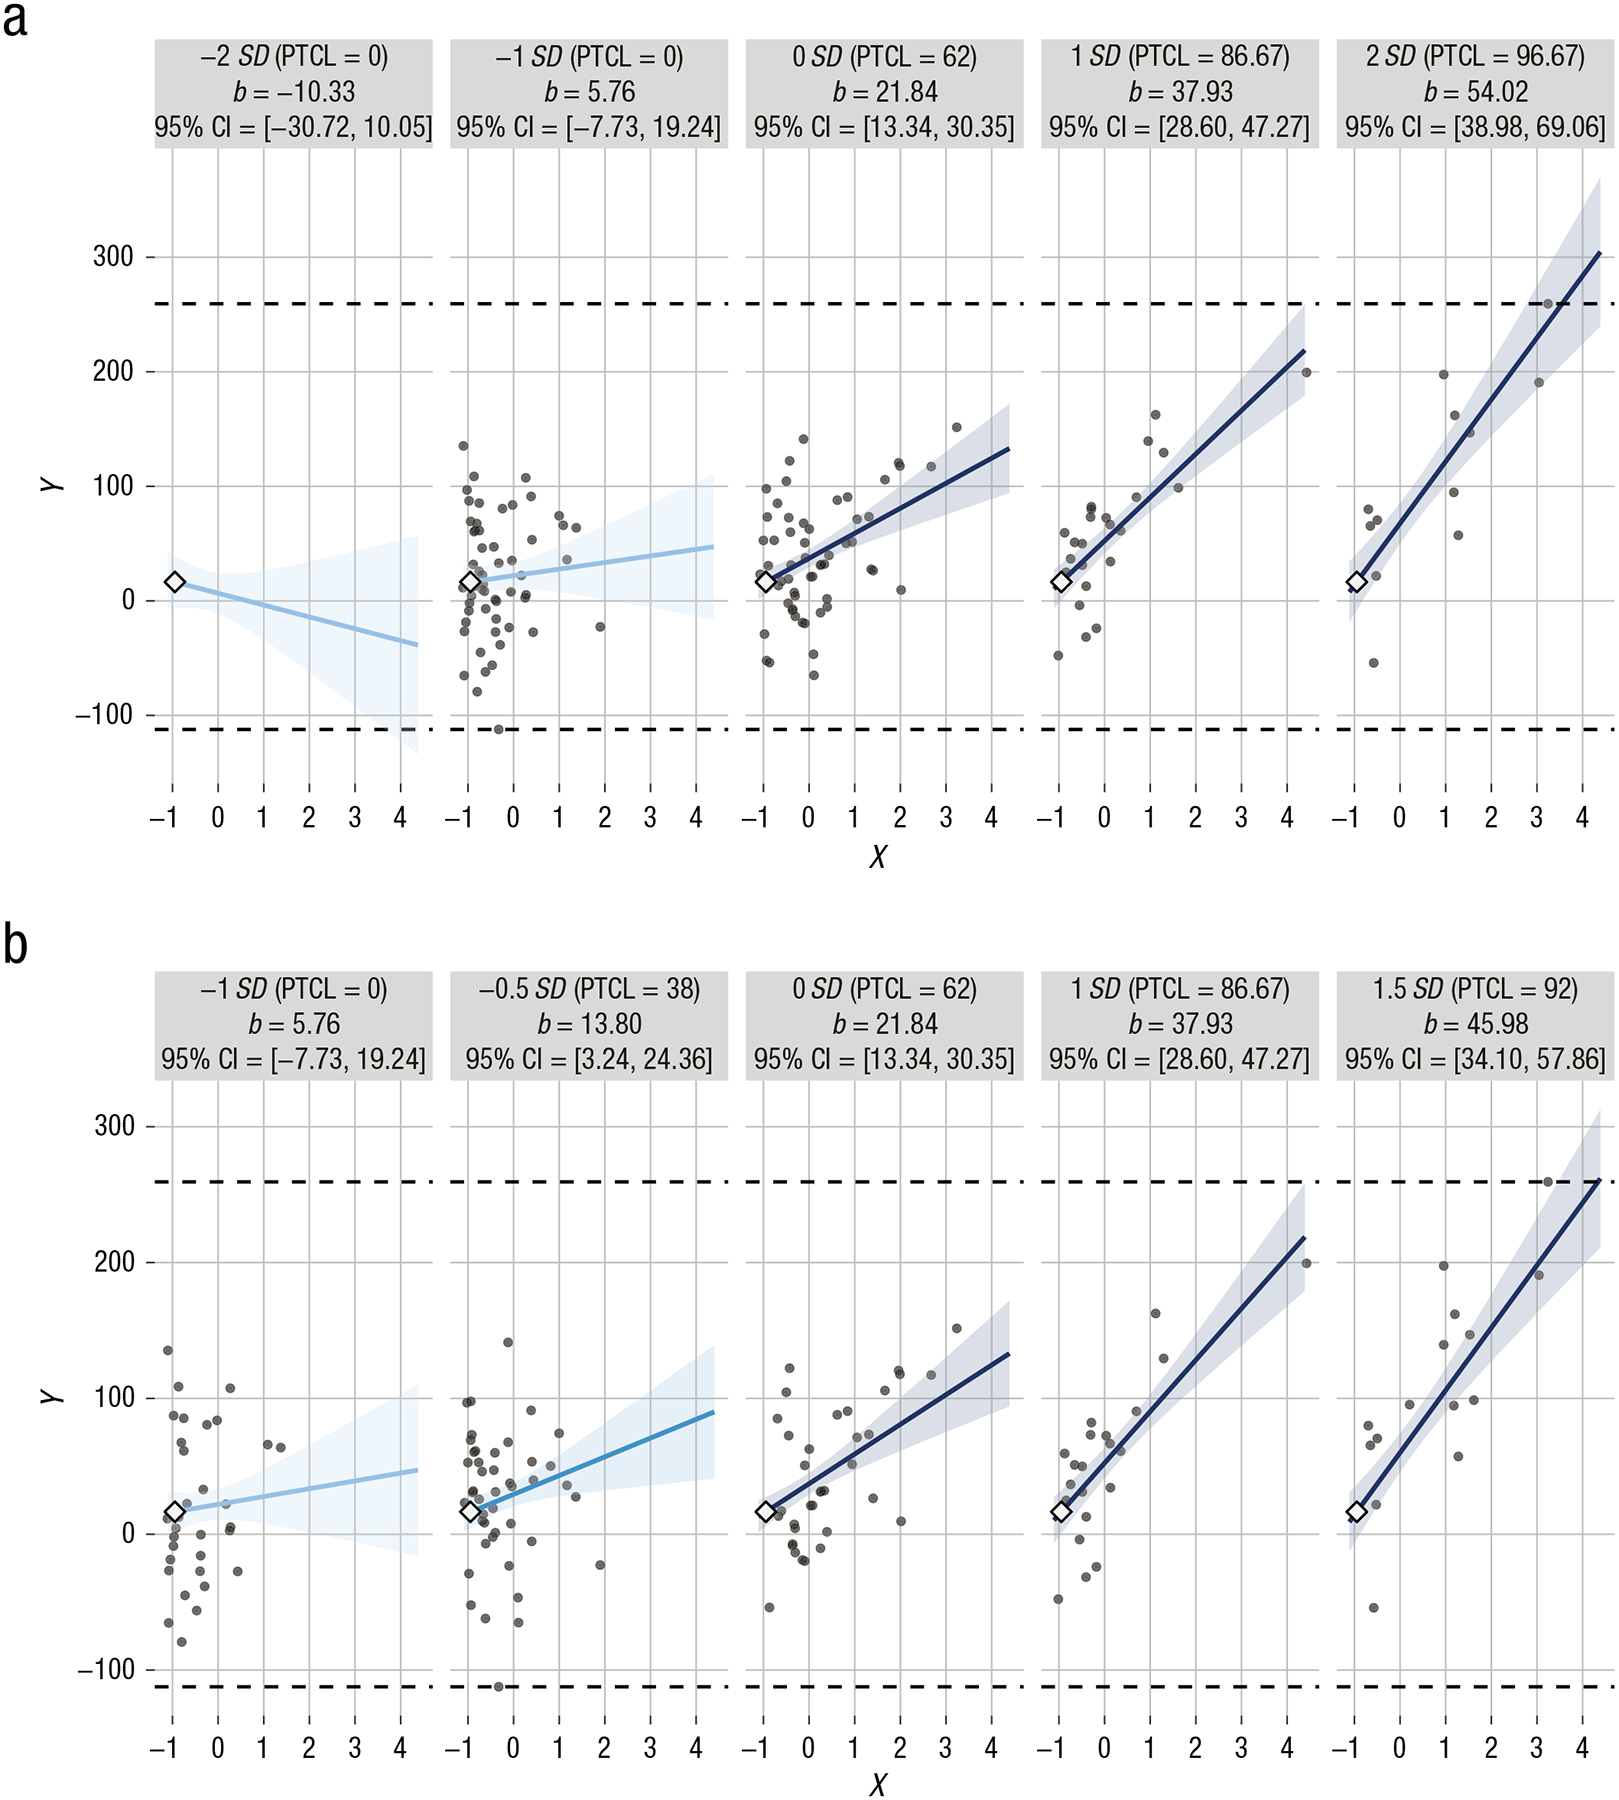
Small multiples created by interActive for Example 1 in a simulation with exponentially distributed predictors. In (a), simple slopes are provided for levels of the moderator 2 SD and 1 SD below the mean, at the mean, and 1 SD and 2 SD above the mean. The observed data are better characterized in (b), which provides simple slopes for a more restricted range of values of the moderator. Each graphic shows the computed 95% confidence region (shaded area), the observed data (gray circles), the maximum and minimum values of the outcome (dashed horizontal lines), and the crossover point (diamond). The x-axes represent the full range of the focal predictor. CI = confidence interval; PTCL = percentile.