
Fig. B1.
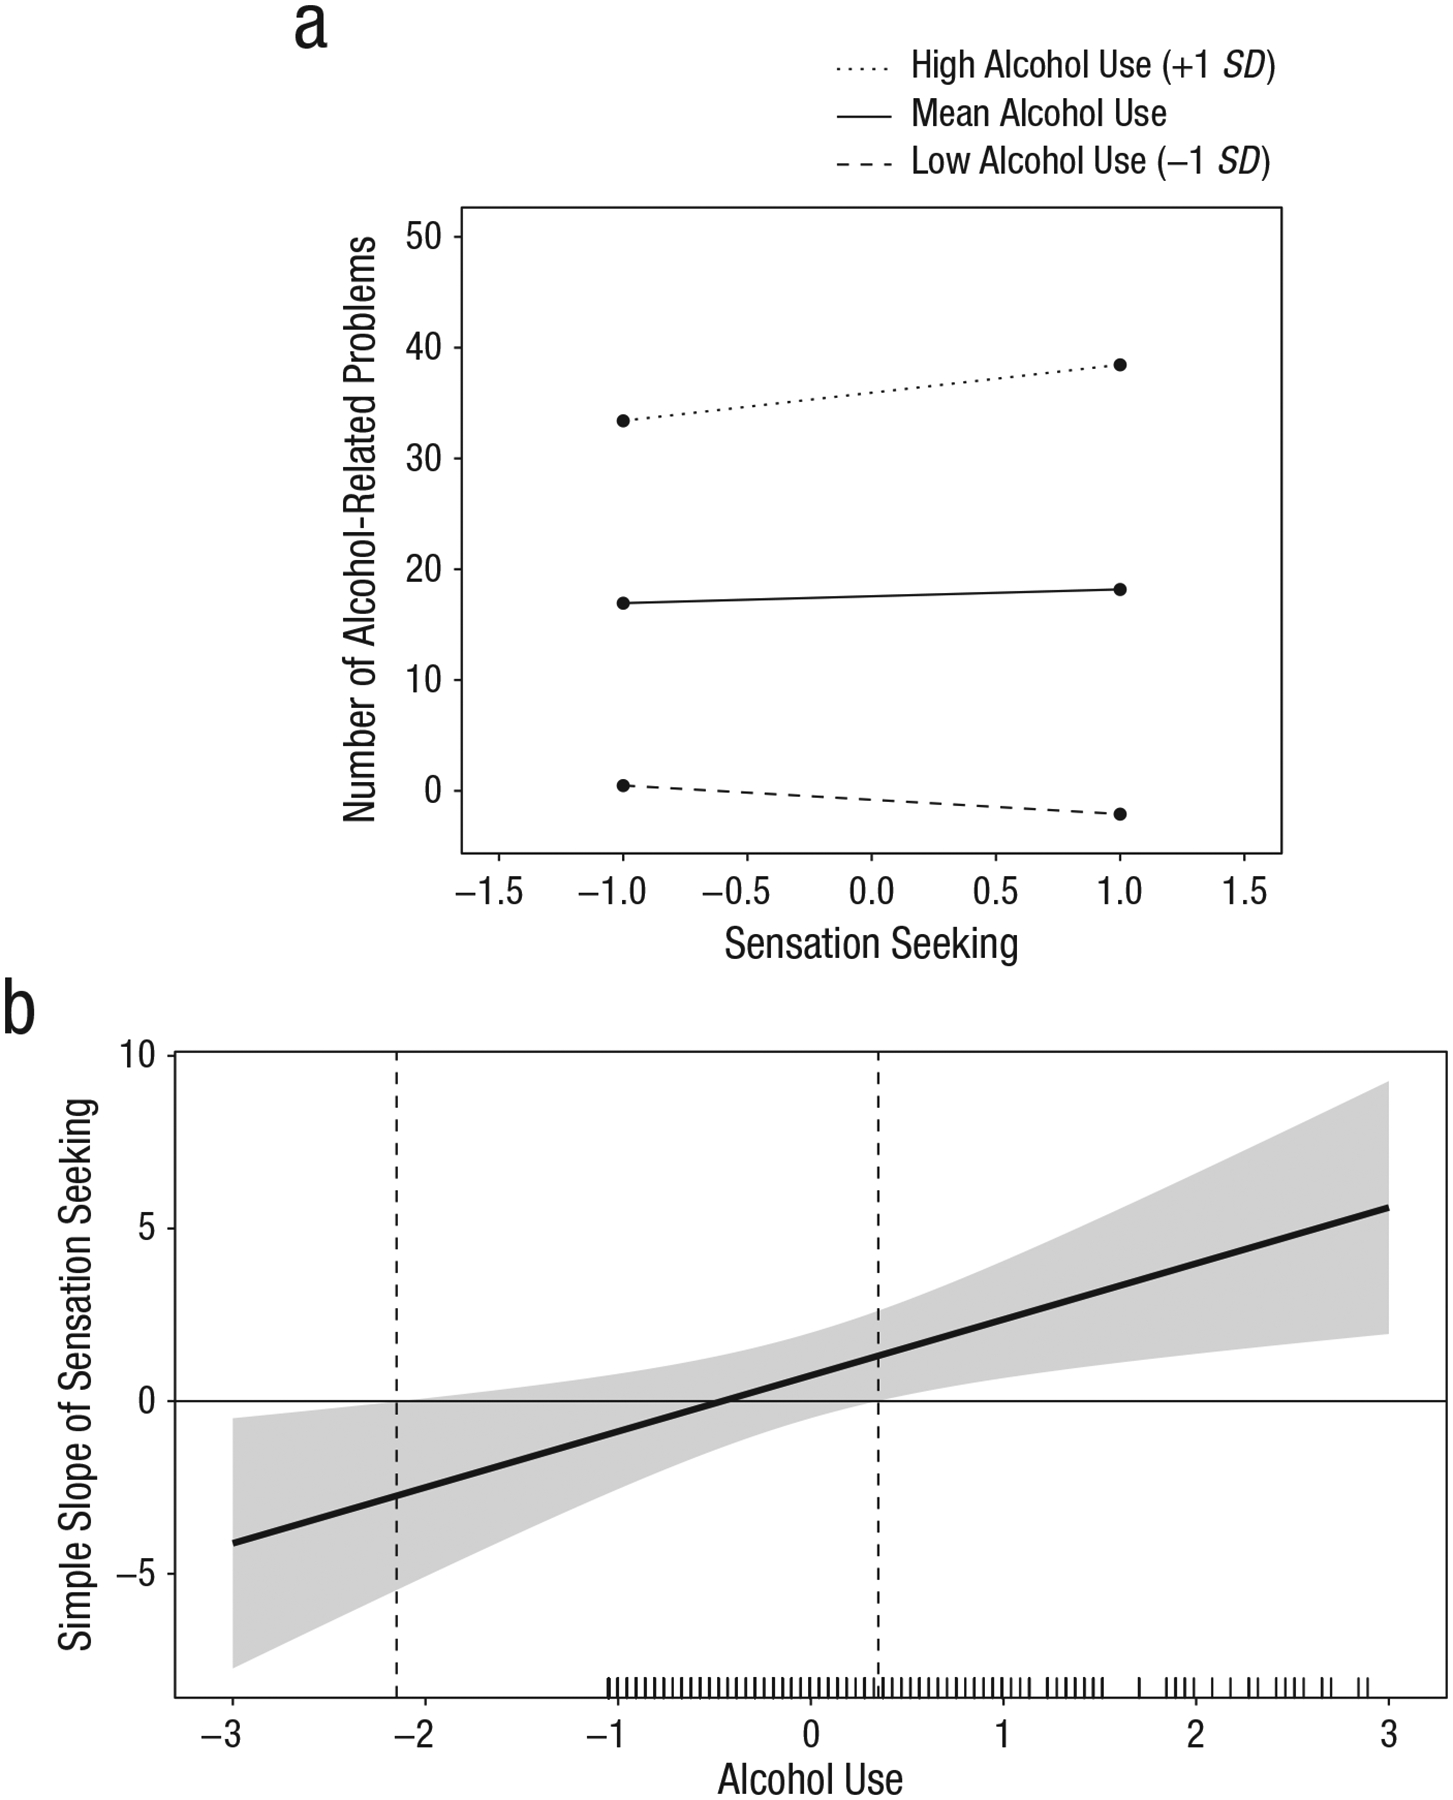
The relation between sensation seeking and the number of alcohol-related problems experienced per year across multiple levels of alcohol use. The graph in (a) shows the simple slopes for the relation between the standardized level of sensation seeking (on the x-axis) and the number of alcohol-related problems (on the y-axis) at low (1 SD below the mean), mean, and high (1 SD above the mean) levels of alcohol use (adapted with permission from K. M. King, Karyadi, Luk, & Patock-Peckham, 2011). The graph in (b) provides a marginal-effects display for the same interaction effect. The x-axis indicates the standardized level of the moderator, and the vertical dashed lines indicate the levels of the moderator at which the focal variable becomes significantly associated with the dependent variable. The 95% confidence region is indicated by the shaded area. A marginal rug showing the frequency of different levels of alcohol use is included.