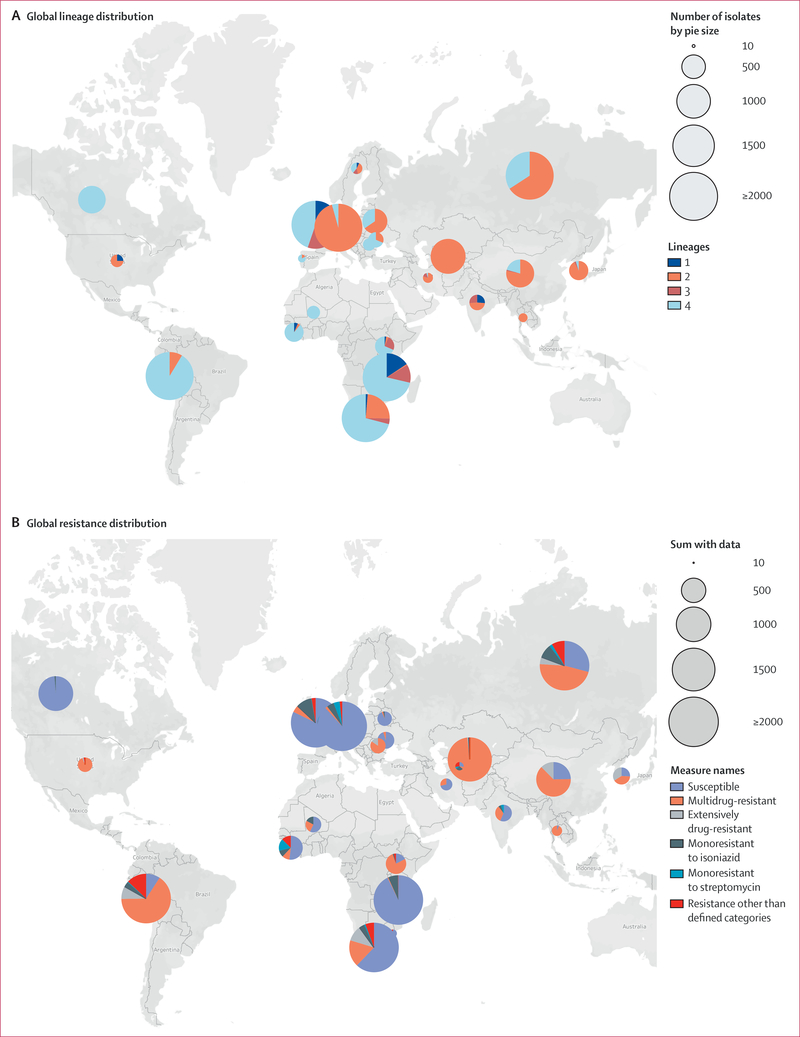
Figure 2: Global distribution of Mycobacterium tuberculosis in the study sample.
For global lineage distribution (n=8477), pie charts represent the proportion of each lineage among isolates available from each country. For global resistance distribution (n=7834), pie charts show the distribution of resistance patterns by country. Pie size is proportional to the number of isolates from each country (appendix pp 8–9). Counts from countries represented by fewer than ten isolates (n=75) not shown.

