
Figure 3: Unsupervised classification of spiny neurons into morphological types.
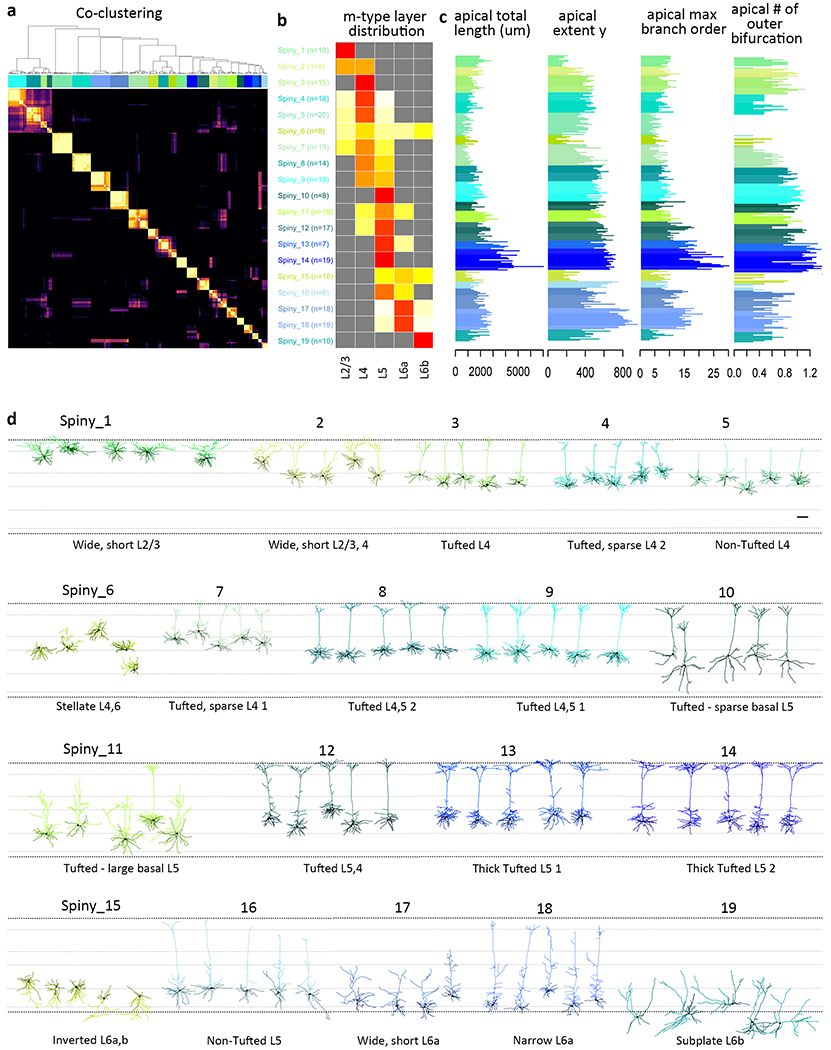
(a) Co-clustering diagram from 1000 runs of hierarchical clustering with 90% subsampled data. 19 morphological types (m-types) are identified by CutreeHybrid()*, which included a step to merge neurons in clusters with an n≤3 with their most highly correlated cluster and clusters with no significantly different features between them. Each m-type is assigned a color that is maintained throughout the figure (n=253 spiny neurons). (b) Laminar distribution of m-types across layers 2/3-6b. Relative proportion of each m-type per layer is shown. (c) Examples of apical dendrite features that vary systematically across m-types. See Supplementary Fig. 19 for all morphological features included in the analysis. (d) Representative examples of each m-type, roughly ordered by their location in layers 2/3-6b. Neurons in each m-type are shown with respect to averaged cortical layers (see methods for details). Each m-type has two names, a numbered name (e.g., Spiny_1) and a descriptive name (e.g., Non-Tufted L4). Apical dendrites are shown in the lighter color and basal dendrites in the darker color. Morphology scale bar: 100 μm. See Supplementary Fig. 18 for individual morphologies that went into this clustering analysis and Supplementary Fig. 22 for m-type representation across transgenic lines. All reconstructions and the corresponding images are available online (http://celltypes.brain-map.org/).