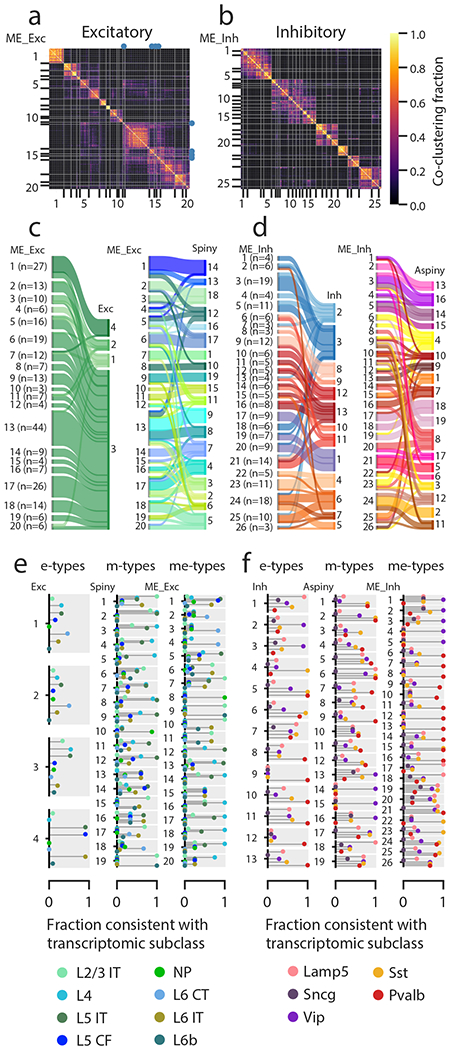
Figure 5: Classification using paired electrophysiological and morphological data.

(a) Excitatory cellwise co-clustering matrix (across several clustering methods and weights) with consensus clusters (me-types) identified (n=253 excitatory cells with both electrophysiological data and morphological reconstructions). The me-types that were identified as unstable by subsampling analysis are identified with blue dots. (b) Same as (a) but for inhibitory cells (n=199). (c-d) Correspondences between me-types and either e-types or m-types for excitatory (c) and inhibitory (d) cells. Widths of bars are proportional to the numbers of cells in a type. (e) Consistency of excitatory e-types, m-types, and me-types with transcriptomic subclasses as inferred from transgenic line compositions. The plot for each type has separate bars for each transcriptomic subclass identified by different colors; each type has the same set of bars (see legend for labels). A consistency value close to 1 means that most of the cells with that type came from transgenic lines that were all consistent with labeling that subclass, while a value close to 0 means that cells came from lines that do not label that subclass (see Supplementary Fig. 1), based on FACS data from another study14. A single consistency value of 1 (e.g., ME_Exc_8) indicates that all the cells of that type are from the indicated transcriptomic subclass (by virtue of all cells being from one or more unambiguous transgenic lines). IT: intratelencephalic, CF: corticofugal, NP: near-projecting, CT: corticothalamic. (f) Same as (e) but for inhibitory cells.
