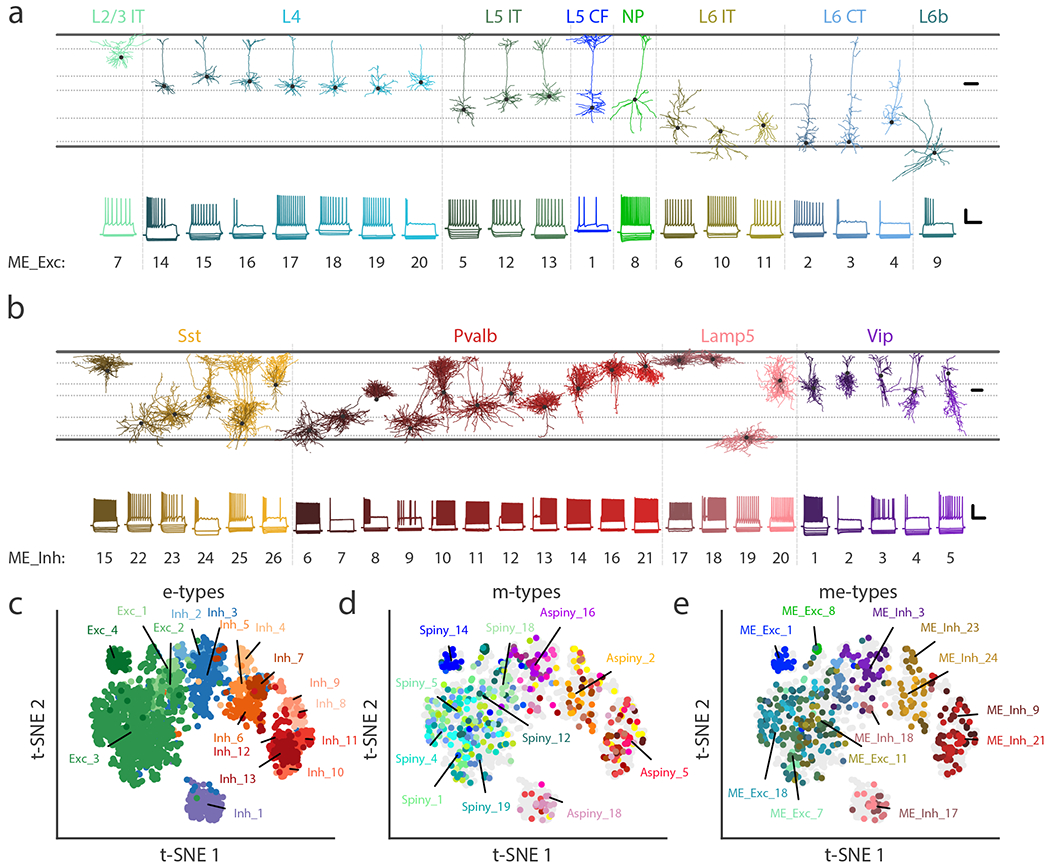
Figure 6: Transcriptomic subclasses and me-types.

(a) Example cells from each excitatory me-type grouped by putative transcriptomic subclass. Top shows morphological reconstructions of dendrites and bottom shows electrophysiological responses from the same examplar cell. Some notable specific types include non-tufted (ME_Exc_18 & 20), thick-tufted (ME_Exc_1), and inverted (ME_Exc_10 & 11) pyramidal cells. See Supplementary Table 3 for detailed descriptions of each me-type. Morphology scale bar: 100 μm. Electrophysiology scale bar: vertical, 40 mV; horizontal, 500 ms. IT: intratelencephalic, CF: corticofugal, NP: near-projecting, CT: corticothalamic. (b) Same as (a) but for inhibitory me-types, except both axonal (lighter shades) and dendritic (darker shades) compartments are shown. Some notable specific types include deep non-Martinotti cells (ME_Inh_22 & 23), Martinotti cells (ME_Inh_15, 24, 25), chandelier cells (ME_Inh_21), and late-spiking L1 neurogliaform cells (ME_Inh_17). (c-e) t-SNE plots based on electrophysiological features (n=1,938 cells) showing e-types (c), m-types (d), and me-types (e). Colors correspond to Figs. 2-4 for e- and m-types and to (a-b) for me-types.
