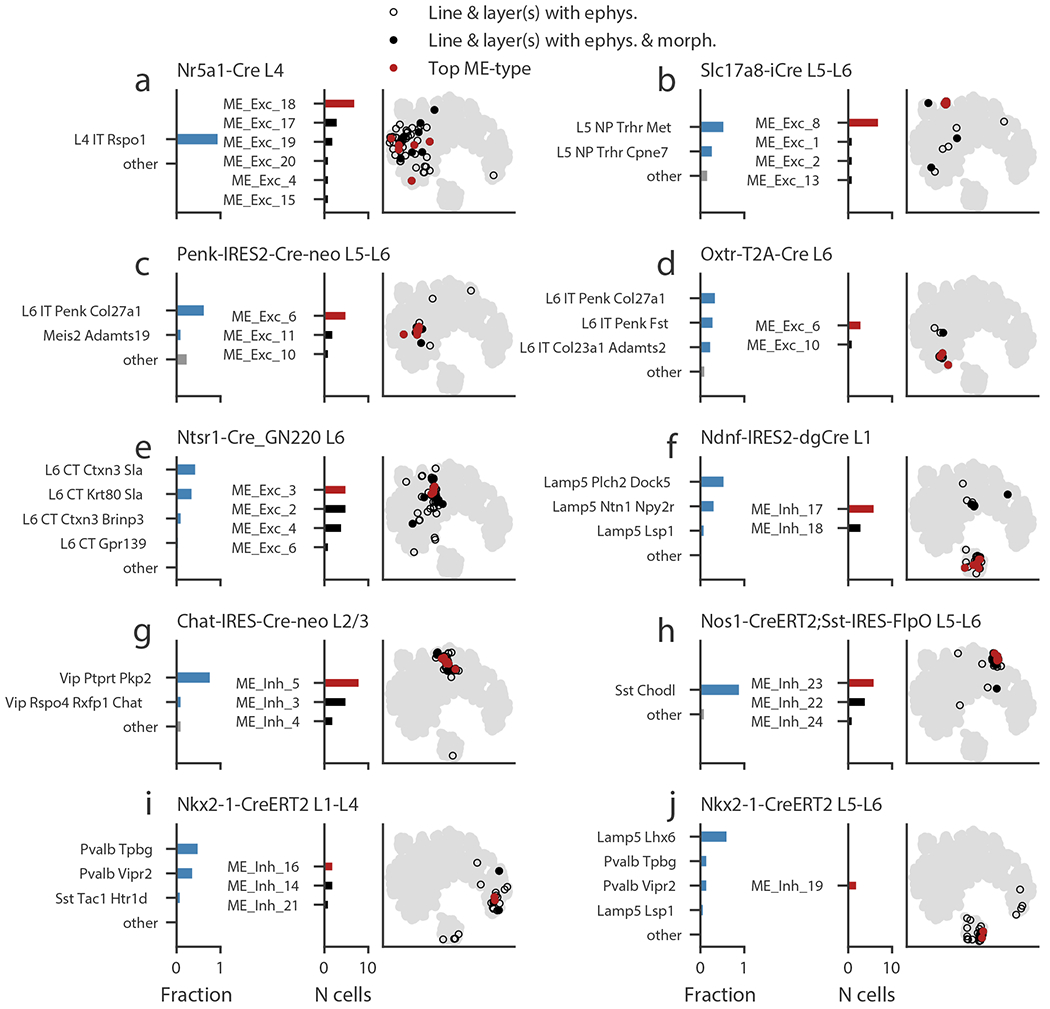
Figure 7: Correspondence of me-types with transcriptomic types.

(a-j) Transgenic line/layer combinations that label transcriptomic types (t-types) and the corresponding me-types. Left bar chart shows the fraction of cells in a t-type identified by another study from FACS data collected with similar transgenic line and layer sampling. The t-types with fractions of 0.05 or more are shown individually; the remaining are grouped as “other.” Right bar chart shows the me-type distribution of cells in this study collected from the specified transgenic line/layer combination. The most common me-type is shown in red. Note that only cells with both electrophysiological data and a morphological reconstruction appear in this plot. The t-SNE plot based on electrophysiological features shows all cells with electrophysiology (gray), cells from the specified line/layer combination (hollow black circles), cells from the line/layer combination that also have morphological reconstructions (filled black circles), and those cells with the most-common me-type (red circles).
