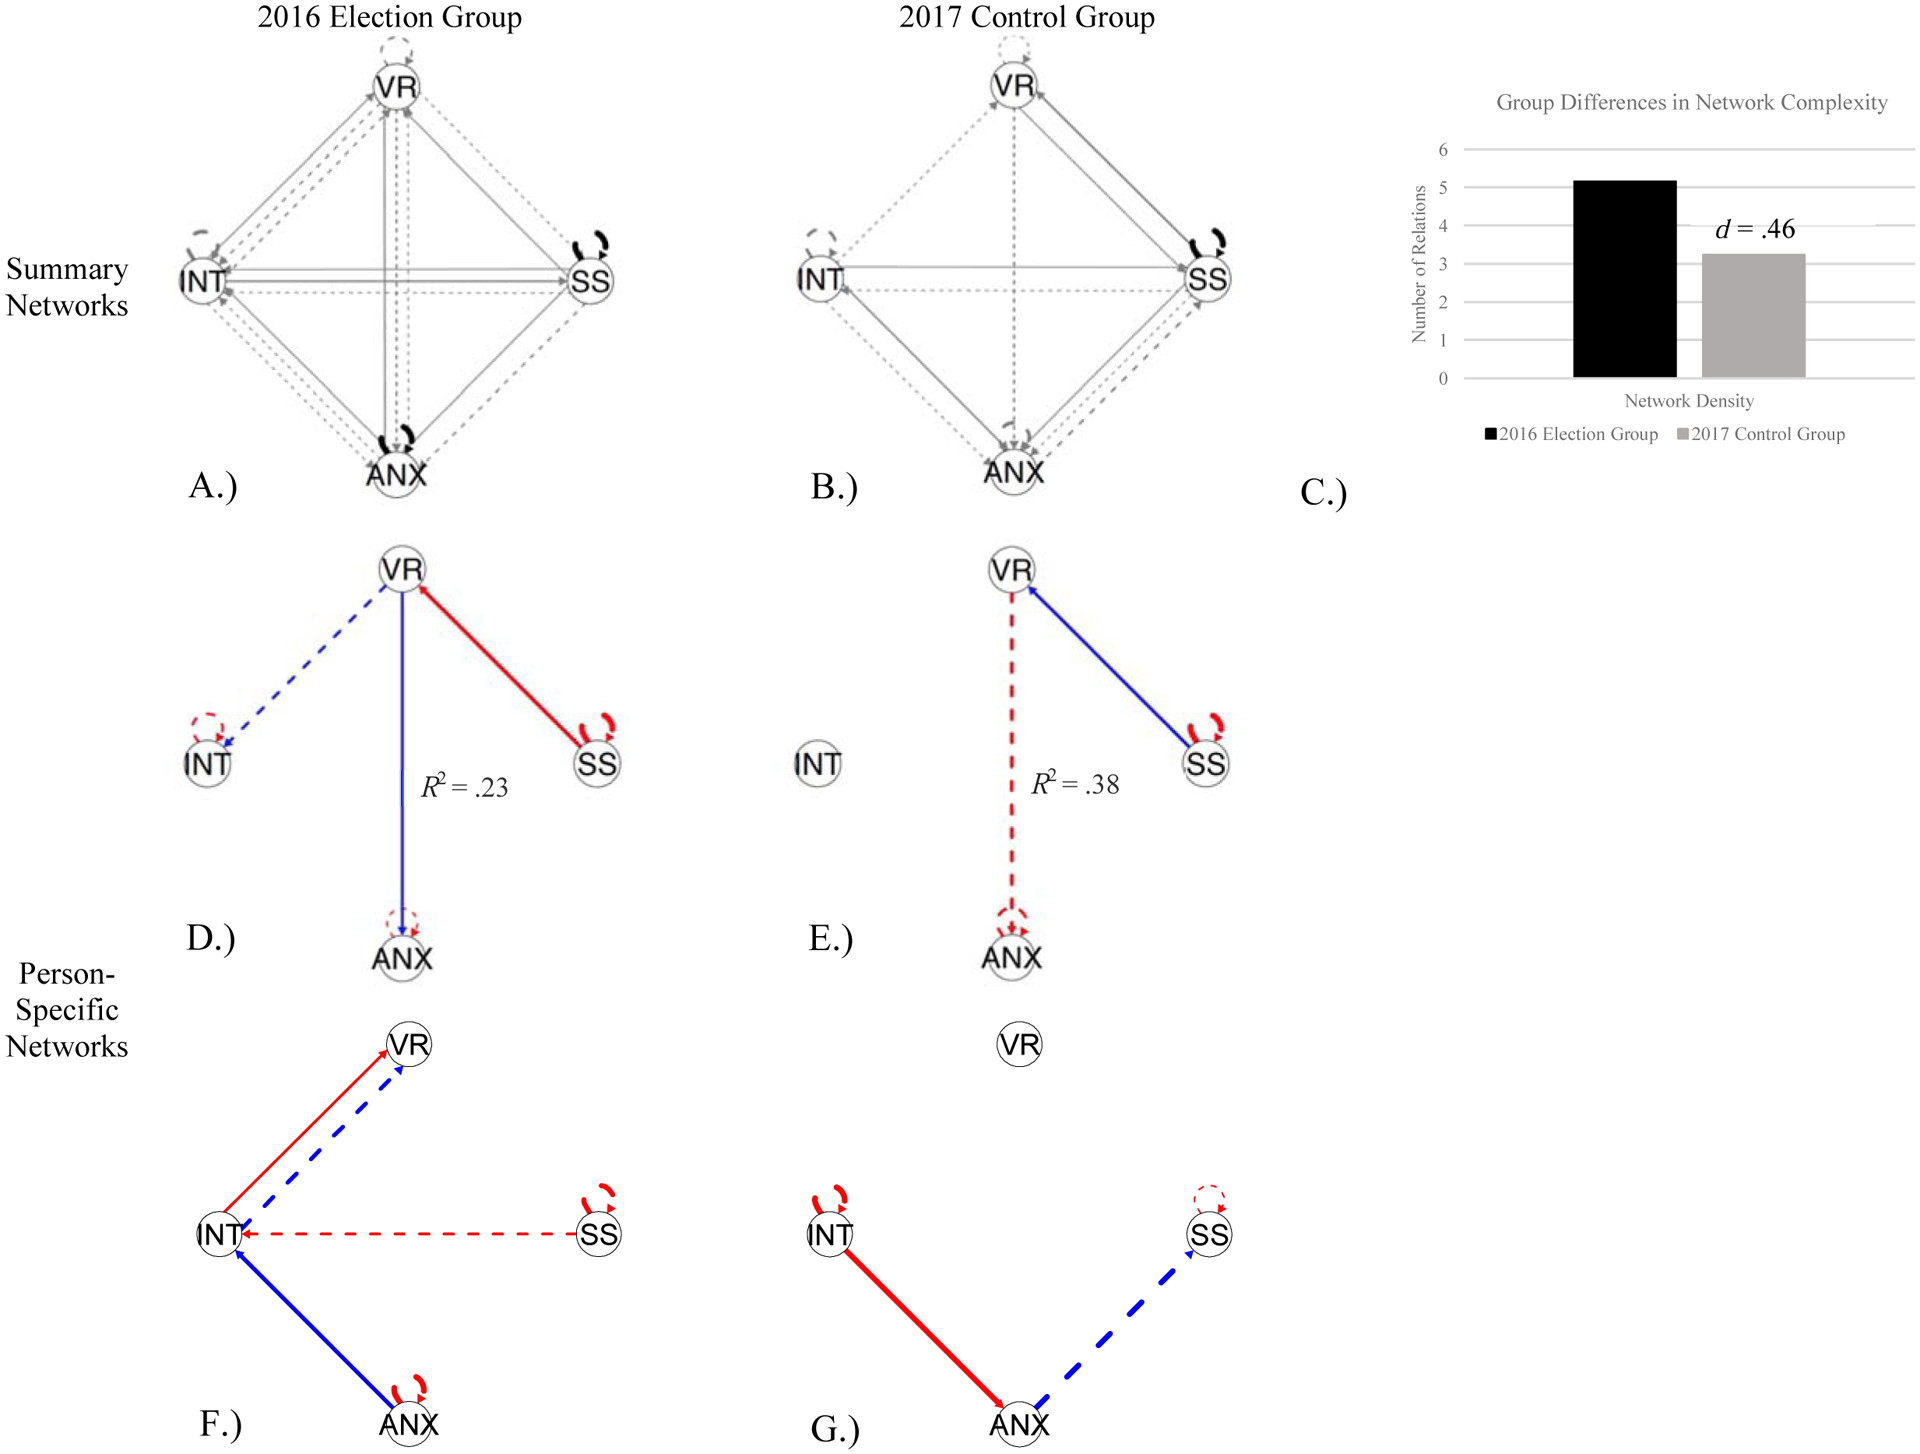
Figure 3.

Networks depicting results of a person-specific model (i.e., GIMME) used to analyze 75-day intensive longitudinal data. Circles reflect nodes/variables, solid lines reflect same-day relations, dashed lines reflect lagged next-day relations, black lines reflect group-level relations in summary networks, gray lines reflect individual-level relations in summary networks (thickness is proportion of students with a given relation), blue lines reflect negative relations in person-specific networks, and red lines reflect positive relations in person-specific networks; for blue and red lines, thickness reflects relation magnitude. All networks fit the data well; see Supplemental Materials Table S3 for fit indices. A.) Summary network for students during a period of heightened sociopolitical stress (i.e., the 2016 election group) with two group-level autoregressive effects for somatic symptoms and anxiety. B.) Summary network for students in 2017 (i.e., the control group) with one group-level autoregressive effect for somatic symptoms. C.) Group differences in network complexity (i.e., the number of connections per network). D.) Example student-specific network from the election group with a negative, contemporaneous relation between verbal recall and anxiety (among others). E.) Example student-specific network from the control group with a positive, lagged relation between verbal recall and anxiety (among others). F.) Example student-specific network from the election group demonstrating denser relations with four edges and two autoregressive effects. G.) Example student-specific network from the control group demonstrating more sparse relations with two edges and two autoregressive effects. The R2 reflects the strength of the relation between delayed verbal recall and anxiety for an individual student (calculated using a formula developed by Peterson & Brown, 2005). VR = delayed verbal recall; SS = somatic symptoms; ANX = anxiety; INT = intellectual interest.
