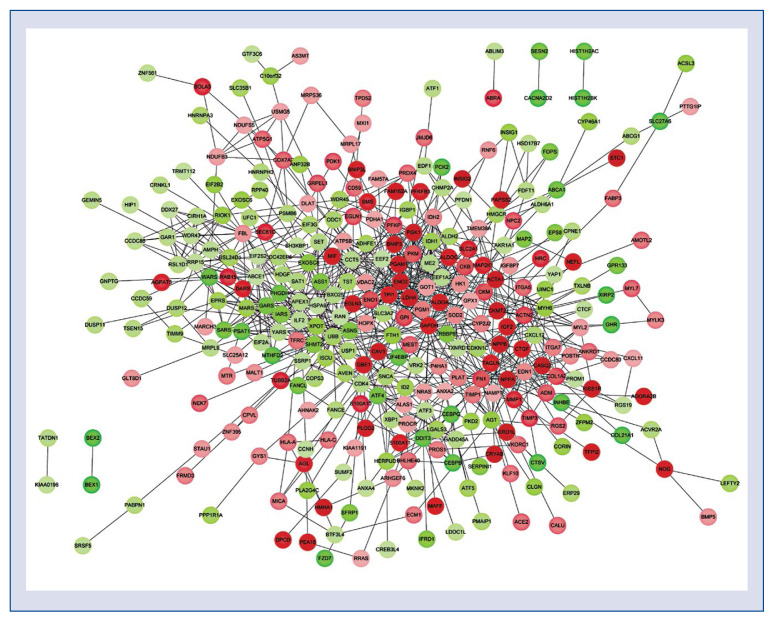
Figure 1.
Protein–protein interaction network of differentially expressed genes in iPS-derived cardiomyocytes treated by glucose, endothelin-1 and cortisol. Circles represent protein products of differentially expressed genes, and red denotes up-regulated, green denotes down-regulated; color depth indicates the significance of differential expressed genes.

