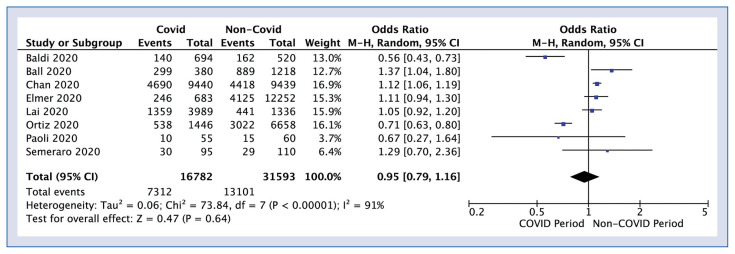
Figure 1.
Forest plot of bystander cardiopulmonary resuscitation rate in COVID-19 versus non-COVID-19 period. The center of each square represents the weighted odds ratios for individual trials, and the corresponding horizontal line stands for a 95% confidence interval (CI). The diamonds represent pooled results.

