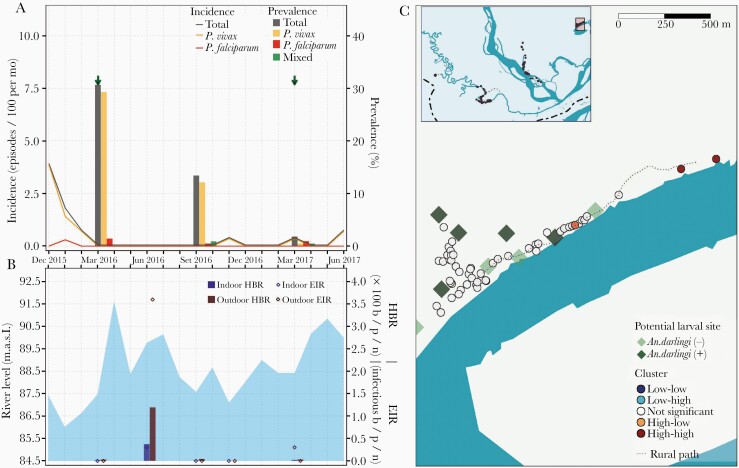
Figure 5.
Parasitological, entomological, and river level observations between January 2016 and June 2017, and spatial clusters of malaria prevalence in March 2016 in Urco Miraño village. A, Evolution of malaria prevalence and incidence rates: Arrows indicate months when test-and-treat interventions were conducted using microscopy. B, Bars represent human biting rates (HBR) and points entomological inoculation rates (EIR) estimated in March, June, September, and November 2016 and in March 2017. Shaded area represents monthly water levels of the Napo River. C, Spatial distribution of households classified according to local Moran I as high-high, high-low, not significant, low-high, and low-low clusters of malaria prevalence in March 2016. Abbreviations: b/p/n, bites/person/night; MASL, meters above sea level.

