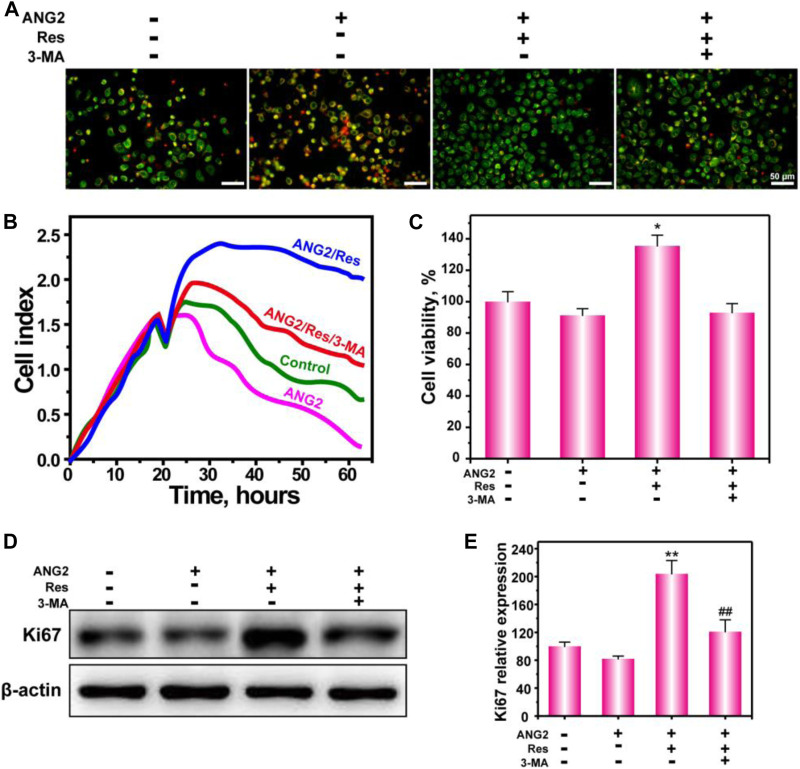
FIGURE 5.
Survival of HUVECs treated with ANG2, Res, and 3-MA in an oxygen-deficient environment. AO-EB staining at 24 h (A), real-time cell growth curve (B), cell viability by MTT assay at 24 h (C), and protein expression of Ki67 (D). The values are represented as the mean ± SD (n = 3). *p < 0.05, **p < 0.01 vs ANG2 group; # p < 0.05, ## p < 0.01 vs ANG2/Res group.

